Cabela's 2008 Annual Report Download - page 95
Download and view the complete annual report
Please find page 95 of the 2008 Cabela's annual report below. You can navigate through the pages in the report by either clicking on the pages listed below, or by using the keyword search tool below to find specific information within the annual report.-
 1
1 -
2
-
3
-
4
-
5
-
6
-
7
-
8
-
9
-
10
-
11
-
12
-
13
-
14
-
15
-
16
-
17
-
18
-
19
-
20
-
21
-
22
-
23
-
24
-
25
-
26
-
27
-
28
-
29
-
30
-
31
-
32
-
33
-
34
-
35
-
36
-
37
-
38
-
39
-
40
-
41
-
42
-
43
-
44
-
45
-
46
-
47
-
48
-
49
-
50
-
51
-
52
-
53
-
54
-
55
-
56
-
57
-
58
-
59
-
60
-
61
-
62
-
63
-
64
-
65
-
66
-
67
-
68
-
69
-
70
-
71
-
72
-
73
-
74
-
75
-
76
-
77
-
78
-
79
-
80
-
81
-
82
-
83
-
84
-
 85
85 -
 86
86 -
 87
87 -
 88
88 -
 89
89 -
 90
90 -
 91
91 -
 92
92 -
 93
93 -
 94
94 -
 95
95 -
 96
96 -
 97
97 -
 98
98 -
 99
99 -
 100
100 -
 101
101 -
 102
102 -
 103
103 -
 104
104 -
 105
105 -
106
-
107
-
108
-
109
-
110
-
111
-
112
-
113
-
114
-
115
-
116
-
117
 |
 |

90
CABELA’S INCORPORATED AND SUBSIDIARIES
NOTES TO CONSOLIDATED FINANCIAL STATEMENTS
(Dollars in Thousands Except Share and Per Share Amounts)
amortization method over the vesting period. As of December 27, 2008, the total unrecognized deferred share-based
compensation balance for unvested shares issued, net of expected forfeitures, was approximately $7,345, net of tax,
which is expected to be amortized over a weighted average period of 2.2 years.
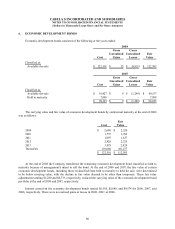
The fair value of options granted on and subsequent to May 1, 2004, is estimated on the date of the grant
using the Black-Scholes option pricing model. The expected volatility for 2008 and 2007 was based on the historical
volatility of our common stock. For 2006, the expected volatility was derived using a historical volatility model as
well as comparisons to peers in our market sector.
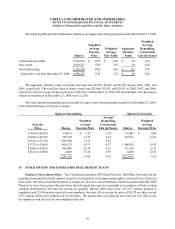
The fair value of options in the years presented was estimated using the Black-Scholes model with the following
weighted average assumptions:
2008 2007 2006
Risk-free interest rate based on U.S. Treasury yield
curve in effect at the grant date 1.34 to 3.22% 3.31 to 4.63% 5.01%
Dividend yield - - -
Expected volatility 35 to 43% 30 to 33% 50%
Weighted average expected life based on historical information 5.0 years 5.0 years 6.0 years
Weighted average grant date fair value of options granted $ 5.49 $ 7.82 $10.45
The following table summarizes our option activity during 2008:
All Options Non-Vested Options
Weighted
Average
Exercise
Price
Weighted
Average
Grant Date
Fair Value
Options
Available
for Grant Number
of Options Number
of Options
Outstanding, beginning of year 2,529,196 5,312,444 $16.28 2,915,315 $ 7.36
Granted (1,085,077)1,085,077 15.19 1,085,077 5.49
Restricted stock issued (111,324)
Vested - - - (1,156,454)11.12
Exercised - (769,608) 9.36 - -
Forfeited (1)(2) 208,873 (344,663)16.11 (184,611)4.63
Outstanding, end of year (3) 1,541,668 5,283,250 17.08 2,659,327 5.15
(1) Options forfeited under the 1997 Plan do not become available for grant under the 2004 Plan.
(2) Options forfeited under the 2004 Plan are immediately available for grant.
(3) Options outstanding at the end of 2008 were comprised of 785,535 of incentive stock options and 4,497,715 of
nonqualified stock options.