Cabela's 2008 Annual Report Download - page 40
Download and view the complete annual report
Please find page 40 of the 2008 Cabela's annual report below. You can navigate through the pages in the report by either clicking on the pages listed below, or by using the keyword search tool below to find specific information within the annual report.-
 1
1 -
2
-
3
-
4
-
5
-
6
-
7
-
8
-
9
-
10
-
11
-
12
-
13
-
14
-
15
-
16
-
17
-
18
-
19
-
20
-
21
-
22
-
23
-
24
-
25
-
26
-
27
-
28
-
29
-
 30
30 -
 31
31 -
 32
32 -
 33
33 -
 34
34 -
 35
35 -
 36
36 -
 37
37 -
 38
38 -
 39
39 -
 40
40 -
 41
41 -
 42
42 -
 43
43 -
 44
44 -
 45
45 -
 46
46 -
 47
47 -
 48
48 -
 49
49 -
 50
50 -
51
-
52
-
53
-
54
-
55
-
56
-
57
-
58
-
59
-
60
-
61
-
62
-
63
-
64
-
65
-
66
-
67
-
68
-
69
-
70
-
71
-
72
-
73
-
74
-
75
-
76
-
77
-
78
-
79
-
80
-
81
-
82
-
83
-
84
-
85
-
86
-
87
-
88
-
89
-
90
-
91
-
92
-
93
-
94
-
95
-
96
-
97
-
98
-
99
-
100
-
101
-
102
-
103
-
104
-
105
-
106
-
107
-
108
-
109
-
110
-
111
-
112
-
113
-
114
-
115
-
116
-
117
 |
 |

35
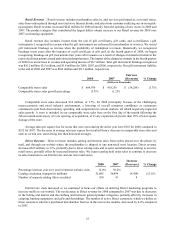
Retail Revenue – Retail revenue includes merchandise sales in, and services performed at, our retail stores,
sales from orders placed through our retail store Internet kiosks, and sales from customers utilizing our in-store pick-
up program. Retail revenue increased $242 million for 2008 primarily from the opening of new stores in 2008 and
2007. The product category that contributed the largest dollar volume increase to our Retail revenue for 2008 over
2007 was hunting equipment.
Retail revenue also includes income from the sale of gift certificates, gift cards, and e-certificates (“gift
instruments”) recognized in revenue when the gift instruments are redeemed for merchandise or services. We record
gift instrument breakage as revenue when the probability of redemption is remote. Historically, we recognized
breakage seven years after the issuance of a gift certificate or gift card. In the fourth quarter of 2008, we began
recognizing breakage on gift instruments four years after issuance as a result of changes in historical trends in the
types of gift instruments issued and related redemption rates. The impact of the change in estimate in the fourth quarter
of 2008 was an increase in revenue and operating income of $8.7 million. Total gift instrument breakage recognized
was $10.2 million, $1.5 million, and $1.4 million for 2008, 2007, and 2006, respectively. Our gift instrument liability
at the end of 2008 and 2007 was $106 million and $113 million, respectively.
2008 2007 Increase
(Decrease) % Change
(Dollars in Thousands)
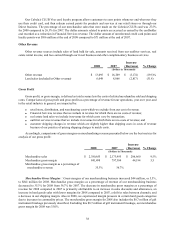
Comparable stores sales $ 884,970 $919,258 $(34,288)(3.7)%
Comparable stores sales growth percentage (3.7)% (1.2)%
Comparable store sales decreased $34 million, or 3.7%, for 2008 principally because of the challenging
macroeconomic and retail industry environment, a lowering of overall consumer confidence as consumers
continued to pull back discretionary spending, and competition in certain markets, all which negatively impacted
sales growth. A store is included in our comparable store sales base on the first day of the month following the
fifteen month anniversary of 1) its opening or acquisition, or 2) any expansion of greater than 25% of total square
footage of the store.
Average sales per square foot for stores that were open during the entire year were $301 for 2008 compared to
$332 for 2007. The decrease in average sales per square foot resulted from a decrease in comparable store sales and
sales at certain new stores being less than historical averages.
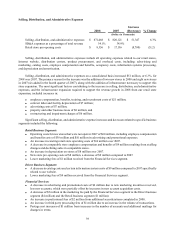
Direct Revenue – Direct revenue includes catalog and Internet sales from orders placed over the phone, by
mail, and through our website where the merchandise is shipped to any non-retail store location. Direct revenue
decreased $35 million, or 3.1%, primarily due to lower catalog sales and to some cannibalization relating to our new
retail stores, partially offset by increased Internet sales. We expect catalog mail order sales to continue to decrease
as sales transition to our Internet site and our new retail stores.
2008 2007 Increase
(Decrease) % Change
Percentage increase year over year in Internet website visits 32.0%30.2%
Catalog circulation in pages (in millions) 32,085 36,499 (4,414)(12.1)%
Number of separate catalog titles circulated 100 91 9
Internet site visits increased as we continued to focus our efforts on utilizing Direct marketing programs to
increase traffic to our website. The net decrease in Direct revenue for 2008 compared to 2007 was due to decreases
in the fishing and marine and the clothing and footwear general product categories, partially offset by increases in
camping, hunting equipment, and gifts and furnishings. The number of active Direct customers, which we define as
those customers who have purchased merchandise from us in the last twelve months, decreased by 4.0% compared
to 2007.