Cabela's 2008 Annual Report Download - page 71
Download and view the complete annual report
Please find page 71 of the 2008 Cabela's annual report below. You can navigate through the pages in the report by either clicking on the pages listed below, or by using the keyword search tool below to find specific information within the annual report.-
 1
1 -
2
-
3
-
4
-
5
-
6
-
7
-
8
-
9
-
10
-
11
-
12
-
13
-
14
-
15
-
16
-
17
-
18
-
19
-
20
-
21
-
22
-
23
-
24
-
25
-
26
-
27
-
28
-
29
-
30
-
31
-
32
-
33
-
34
-
35
-
36
-
37
-
38
-
39
-
40
-
41
-
42
-
43
-
44
-
45
-
46
-
47
-
48
-
49
-
50
-
51
-
52
-
53
-
54
-
55
-
56
-
57
-
58
-
59
-
60
-
 61
61 -
 62
62 -
 63
63 -
 64
64 -
 65
65 -
 66
66 -
 67
67 -
 68
68 -
 69
69 -
 70
70 -
 71
71 -
 72
72 -
 73
73 -
 74
74 -
 75
75 -
 76
76 -
 77
77 -
 78
78 -
 79
79 -
 80
80 -
 81
81 -
82
-
83
-
84
-
85
-
86
-
87
-
88
-
89
-
90
-
91
-
92
-
93
-
94
-
95
-
96
-
97
-
98
-
99
-
100
-
101
-
102
-
103
-
104
-
105
-
106
-
107
-
108
-
109
-
110
-
111
-
112
-
113
-
114
-
115
-
116
-
117
 |
 |

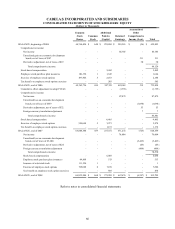
66
CABELA’S INCORPORATED AND SUBSIDIARIES
CONSOLIDATED STATEMENTS OF STOCKHOLDERS’ EQUITY
(Dollars in Thousands)
Accumulated
Common Additional Other
Stock Common Paid-In Retained Comprehensive
Shares Stock Capital Earnings Income (Loss) Total
BALANCE, beginning of 2006 64,764,454 $648 $239,868 $399,363 $(26) $ 639,853
Comprehensive income:
Net income - - - 85,785 -85,785
Unrealized gain on economic development
bonds, net of taxes of $187 - - - - 311 311
Derivative adjustment, net of taxes of $19 - - - - 30 30
Total comprehensive income 86,126
Stock based compensation - - 3,462 - - 3,462
Employee stock purchase plan issuances 101,336 11,643 - - 1,644
Exercise of employee stock options 497,946 52,183 - - 2,188
Tax benefit on employee stock option exercises - - 585 - - 585
BALANCE, end of 2006 65,363,736 654 247,741 485,148 315 733,858
Cumulative effect adjustment to adopt FIN 48 - - - (1,755) - (1,755)
Comprehensive income:
Net income - - - 87,879 -87,879
Unrealized loss on economic development
bonds, net of taxes of $659 - - - - (1,098)(1,098)
Derivative adjustment, net of taxes of $32 - - - - 53 53
Foreign currency translation adjustment - - - - 7 7
Total comprehensive income 86,841
Stock based compensation - - 4,465 - - 4,465
Exercise of employee stock options 524,648 53,973 - - 3,978
Tax benefit on employee stock option exercises - - 1,172 - - 1,172
BALANCE, end of 2007 65,888,384 659 257,351 571,272 (723)828,559
Net income - - - 76,404 -76,404
Unrealized loss on economic development
bonds, net of taxes of $3,200 - - - - (5,425)(5,425)
Derivative adjustment, net of taxes of $24 - - - - (43)(43)
Foreign currency translation adjustment - - - - (406)(406)
Total comprehensive income 70,530
Stock based compensation - - 6,058 - - 6,058
Employee stock purchase plan issuances 64,668 -513 - - 513
Issuance of restricted stock 111,324 1 - - - 1
Exercise of employee stock options 769,608 87,198 - - 7,206
Tax benefit on employee stock option exercises - - 838 - - 838
BALANCE, end of 2008 66,833,984 $668 $271,958 $647,676 $(6,597) $ 913,705
Refer to notes to consolidated financial statements.