Cabela's 2008 Annual Report Download - page 43
Download and view the complete annual report
Please find page 43 of the 2008 Cabela's annual report below. You can navigate through the pages in the report by either clicking on the pages listed below, or by using the keyword search tool below to find specific information within the annual report.-
 1
1 -
2
-
3
-
4
-
5
-
6
-
7
-
8
-
9
-
10
-
11
-
12
-
13
-
14
-
15
-
16
-
17
-
18
-
19
-
20
-
21
-
22
-
23
-
24
-
25
-
26
-
27
-
28
-
29
-
30
-
31
-
32
-
 33
33 -
 34
34 -
 35
35 -
 36
36 -
 37
37 -
 38
38 -
 39
39 -
 40
40 -
 41
41 -
 42
42 -
 43
43 -
 44
44 -
 45
45 -
 46
46 -
 47
47 -
 48
48 -
 49
49 -
 50
50 -
 51
51 -
 52
52 -
 53
53 -
54
-
55
-
56
-
57
-
58
-
59
-
60
-
61
-
62
-
63
-
64
-
65
-
66
-
67
-
68
-
69
-
70
-
71
-
72
-
73
-
74
-
75
-
76
-
77
-
78
-
79
-
80
-
81
-
82
-
83
-
84
-
85
-
86
-
87
-
88
-
89
-
90
-
91
-
92
-
93
-
94
-
95
-
96
-
97
-
98
-
99
-
100
-
101
-
102
-
103
-
104
-
105
-
106
-
107
-
108
-
109
-
110
-
111
-
112
-
113
-
114
-
115
-
116
-
117
 |
 |

38
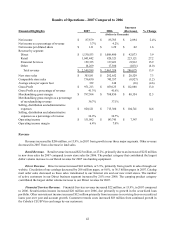
Our Cabela’s CLUB Visa card loyalty program allows customers to earn points whenever and wherever they
use their credit card, and then redeem earned points for products and services at our retail stores or through our
Direct business. The percentage of our merchandise sales that were made on the Cabela’s CLUB card was 27.5%
for 2008 compared to 26.3% for 2007. The dollar amounts related to points are accrued as earned by the cardholder
and recorded as a reduction in Financial Services revenue. The dollar amount of unredeemed credit card points and
loyalty points was $106 million at the end of 2008 compared to $71 million at the end of 2007.
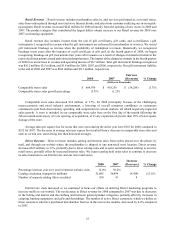
Other Revenue
Other revenue sources include sales of land held for sale, amounts received from our outfitter services, real
estate rental income, and fees earned through our travel business and other complementary business services.
2008 2007 Increase
(Decrease) % Change
(Dollars in Thousands)
Other revenue $ 13,095 $16,269 $(3,174)(19.5)%
Land sales (included in Other revenue) 6,049 8,866 (2,817)(31.8)
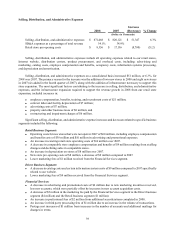
Gross Profit
Gross profit, or gross margin, is defined as total revenue less the costs of related merchandise sold and shipping
costs. Comparisons of gross profit and gross profit as a percentage of revenue for our operations, year over year, and
to the retail industry in general, are impacted by:
• retail store, distribution, and warehousing costs which we exclude from our cost of revenue;
• Financial Services revenue that we include in revenue for which there are no costs of revenue;
• real estate land sales we include in revenue for which costs vary by transaction;
• outfitter services revenue that we include in revenue for which there are no costs of revenue; and
• customer shipping charges in revenue which are slightly higher than shipping costs in costs of revenue
because of our practice of pricing shipping charges to match costs.
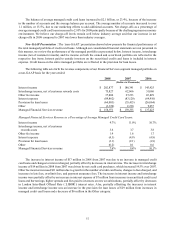
Accordingly, comparisons of gross margins on merchandising revenue presented below are the best metrics for
analysis of our gross profit:
2008 2007 Increase
(Decrease) % Change
(Dollars in Thousands)
Merchandise sales $ 2,380,655 $2,173,995 $206,660 9.5%
Merchandise gross margin 841,498 797,304 44,194 5.5
Merchandise gross margin as a percentage of
merchandise revenue 35.3%36.7%
Merchandise Gross Margins – Gross margins of our merchandising business increased $44 million, or 5.5%,
to $841 million for 2008. Merchandise gross margins as a percentage of revenue of our merchandising business
decreased to 35.3% for 2008 from 36.7% for 2007. The decrease in merchandise gross margins as a percentage of
revenue for 2008 compared to 2007 is primarily attributable to an increase in sales discounts and allowances, an
increase in hard goods sales with lower margins for 2008 compared to 2007, a shift in sales between channels, and
a decrease in our shipping margin. Also in 2008, we experienced margin pressure in certain hard goods categories
due to increases in commodity prices. The merchandise gross margin for 2008 also includes the $8.7 million of gift
instrument breakage previously described. Excluding this $8.7 million of gift instrument breakage, our merchandise
gross margin for 2008 was 35.0%.