Cabela's 2008 Annual Report Download - page 34
Download and view the complete annual report
Please find page 34 of the 2008 Cabela's annual report below. You can navigate through the pages in the report by either clicking on the pages listed below, or by using the keyword search tool below to find specific information within the annual report.-
 1
1 -
2
-
3
-
4
-
5
-
6
-
7
-
8
-
9
-
10
-
11
-
12
-
13
-
14
-
15
-
16
-
17
-
18
-
19
-
20
-
21
-
22
-
23
-
 24
24 -
 25
25 -
 26
26 -
 27
27 -
 28
28 -
 29
29 -
 30
30 -
 31
31 -
 32
32 -
 33
33 -
 34
34 -
 35
35 -
 36
36 -
 37
37 -
 38
38 -
 39
39 -
 40
40 -
 41
41 -
 42
42 -
 43
43 -
 44
44 -
45
-
46
-
47
-
48
-
49
-
50
-
51
-
52
-
53
-
54
-
55
-
56
-
57
-
58
-
59
-
60
-
61
-
62
-
63
-
64
-
65
-
66
-
67
-
68
-
69
-
70
-
71
-
72
-
73
-
74
-
75
-
76
-
77
-
78
-
79
-
80
-
81
-
82
-
83
-
84
-
85
-
86
-
87
-
88
-
89
-
90
-
91
-
92
-
93
-
94
-
95
-
96
-
97
-
98
-
99
-
100
-
101
-
102
-
103
-
104
-
105
-
106
-
107
-
108
-
109
-
110
-
111
-
112
-
113
-
114
-
115
-
116
-
117
 |
 |

29
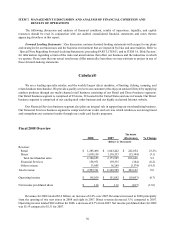
ITEM 6. SELECTED FINANCIAL DATA
Fiscal Year (1)
2008 2007 2006 2005 2004
(In Thousands Except Earnings per Share)
Operations Data:
Revenue:
Merchandise revenue $ 2,380,655 $2,173,995 $1,908,801 $ 1,664,272 $ 1,474,415
Financial services revenue 158,971 159,335 137,423 105,831 69,060
Other revenue 13,095 16,269 17,300 29,558 12,499
Total revenue 2,552,721 2,349,599 2,063,524 1,799,661 1,555,974
Cost of revenue 1,540,214 1,378,386 1,204,399 1,064,322 925,665
Selling, distribution, and
administrative expenses 871,468 820,121 715,380 620,376 533,094
Operating income 141,039 151,092 143,745 114,963 97,215
Interest (expense) income, net (29,658)(18,778)(16,126)(10,256)(7,577)
Other income 6,854 6,913 9,637 10,663 10,443
Income before provision for income taxes 118,235 139,227 137,256 115,370 100,081
Provision for income taxes 41,831 51,348 51,471 42,801 35,085
Net income available to
common stockholders $ 76,404 $87,879 $85,785 $72,569 $64,996
Basic earnings per share $ 1.15 $1.34 $1.32 $1.12 $1.06
Diluted earnings per share $ 1.14 $1.31 $1.29 $1.10 $1.03
Selected Balance Sheet Data:
Cash and cash equivalents (2) $ 410,104 $131,182 $172,903 $86,923 $123,934
Working capital (2) 573,410 263,284 335,387 145,559 274,746
Total assets 2,396,066 2,212,830 1,751,230 1,366,280 1,228,231
Total debt 380,031 503,385 317,873 119,826 148,152
Total stockholders’ equity 913,705 828,559 733,858 639,853 566,354
Other Data:
Depreciation and amortization $ 64,673 $59,863 $45,559 $ 34,912 $ 29,843
Property and equipment additions
including accrued amounts 54,934 364,326 190,592 203,157 52,568
Purchases of economic
development bonds 18,525 36,223 23,397 65,077 74,492
(1) Fiscal years are based on the 52-53 week period ending on the Saturday closest to December 31. Fiscal 2008,
2007, 2006, 2005 and 2004 each consisted of 52 weeks.
(2) Cash and cash equivalents includes amounts for World’s Foremost Bank which were $402 million, $123 million,
$53 million, $81 million, and $58 million at years ended 2008, 2007, 2006, 2005 and 2004. Due to regulatory
restrictions, our ability to use this cash for non-banking operations, including for working capital for our Retail
or Direct businesses or for retail store expansion, is limited.