Cabela's 2008 Annual Report Download - page 48
Download and view the complete annual report
Please find page 48 of the 2008 Cabela's annual report below. You can navigate through the pages in the report by either clicking on the pages listed below, or by using the keyword search tool below to find specific information within the annual report.-
 1
1 -
2
-
3
-
4
-
5
-
6
-
7
-
8
-
9
-
10
-
11
-
12
-
13
-
14
-
15
-
16
-
17
-
18
-
19
-
20
-
21
-
22
-
23
-
24
-
25
-
26
-
27
-
28
-
29
-
30
-
31
-
32
-
33
-
34
-
35
-
36
-
37
-
 38
38 -
 39
39 -
 40
40 -
 41
41 -
 42
42 -
 43
43 -
 44
44 -
 45
45 -
 46
46 -
 47
47 -
 48
48 -
 49
49 -
 50
50 -
 51
51 -
 52
52 -
 53
53 -
 54
54 -
 55
55 -
 56
56 -
 57
57 -
 58
58 -
59
-
60
-
61
-
62
-
63
-
64
-
65
-
66
-
67
-
68
-
69
-
70
-
71
-
72
-
73
-
74
-
75
-
76
-
77
-
78
-
79
-
80
-
81
-
82
-
83
-
84
-
85
-
86
-
87
-
88
-
89
-
90
-
91
-
92
-
93
-
94
-
95
-
96
-
97
-
98
-
99
-
100
-
101
-
102
-
103
-
104
-
105
-
106
-
107
-
108
-
109
-
110
-
111
-
112
-
113
-
114
-
115
-
116
-
117
 |
 |
43
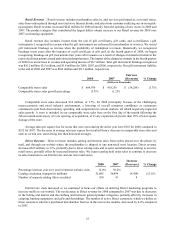
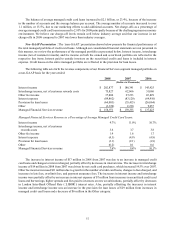
We also measure the results of our Financial Services business on a non-GAAP managed basis as explained
earlier. Interest income measured on a non-GAAP managed basis increased $41 million. The increase in interest
income was due to an increase in interest rates and managed credit card loans. Interchange income, net of reward
costs, increased by $11 million. Interchange income is driven by net purchases, which increased 20.6% over 2006.
Other fee income increased $4 million due to increases of $2 million in late fees and $2 million in payment assurance
fees. The increases in interest income and interchange income were offset by an increase in interest expense of $18
million from increases in securitized credit card loans, borrowings, and interest rates, and by an increase in loan
losses of $9 million because of increases in managed credit card loans and increases in net charge-offs. Compared
to 2006, the number of average active accounts in 2007 grew by 15.7% to over 987,000, and the average balance per
active account increased 7.6% to $1,712.
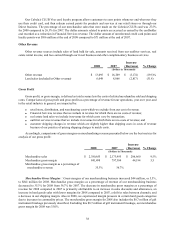
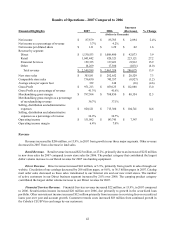
Gross Profit
Gross profit increased by $112 million, or 13.0%, to $971 million for 2007. Financial Services revenue growth
of $22 million resulted in a gross profit percentage increase of 2.6%. Sales of land at higher gross profit margins in
2007 resulted in a gross profit percentage increase of 0.2%. These increases were offset by a decline in merchandising
gross profits. Gross margins of our merchandising business increased $88 million, or 12.5%, to $797 million for
2007. Merchandise gross margins as a percentage of revenue of our merchandising business decreased to 36.7%
for 2007 from 37.1%. Merchandise gross margins for 2007 were negatively impacted by discounts on merchandise
sales associated with advertising and promotional strategies designed to capture additional market share, an increase
in hard goods sales with lower margins, and a decrease in apparel sales with higher margins. This decrease was
partially offset by an increase in our shipping margin for 2007.
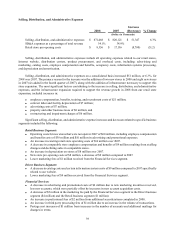
Selling, Distribution, and Administrative Expenses
Selling, distribution, and administrative expenses increased $105 million, or 14.6%, for 2007 over 2006. The
primary reason for the increase in 2007 was the addition of eight new stores in 2007 compared to four added in 2006
along with the addition of infrastructure necessary to support this store expansion. The most significant factors
contributing to the increase in selling, distribution, and administrative expenses, and the infrastructure expansion
required to support the revenue growth in 2007 from our retail store expansion, included:
Retail Business Segment:
• Operating costs for new stores that were not open in the comparable period of 2006 of $54 million, including
employee compensation and benefits costs of $31 million.
• New store pre-opening costs of $17 million, an increase of $7 million over 2006.
• A decrease in comparable store employee compensation and benefits of $1 million resulting from declining
sales in comparable stores.
• Depreciation on new stores not open in the comparable period of 2006 of $9 million.
Direct Business Segment:
• An increase of $6 million in marketing costs primarily from Internet marketing and mailing promotions,
catalog costs from higher postage and print rates, and the addition of five catalogs not circulated in 2006.
• Increases in employee compensation and benefits of $2 million principally for positions added to support
our growth.
• Increases in incidental information system costs of $2 million specifically related to our website.
Financial Services:
• Increases in advertising and promotional costs of $1 million due to increases in new account acquisition costs,
increases in Visa charges driven by increases in credit card transactions, and account retention tools.
• Third party data credit card processing services increased by $2 million as the number of credit card
accounts and credit card transactions increased.
• Postage cost increases of $1 million from increases in the number of accounts and postage rate increases.
• An increase in employee compensation and benefits of $1 million to support our credit card account growth.