Cabela's 2008 Annual Report Download - page 41
Download and view the complete annual report
Please find page 41 of the 2008 Cabela's annual report below. You can navigate through the pages in the report by either clicking on the pages listed below, or by using the keyword search tool below to find specific information within the annual report.-
 1
1 -
2
-
3
-
4
-
5
-
6
-
7
-
8
-
9
-
10
-
11
-
12
-
13
-
14
-
15
-
16
-
17
-
18
-
19
-
20
-
21
-
22
-
23
-
24
-
25
-
26
-
27
-
28
-
29
-
30
-
 31
31 -
 32
32 -
 33
33 -
 34
34 -
 35
35 -
 36
36 -
 37
37 -
 38
38 -
 39
39 -
 40
40 -
 41
41 -
 42
42 -
 43
43 -
 44
44 -
 45
45 -
 46
46 -
 47
47 -
 48
48 -
 49
49 -
 50
50 -
 51
51 -
52
-
53
-
54
-
55
-
56
-
57
-
58
-
59
-
60
-
61
-
62
-
63
-
64
-
65
-
66
-
67
-
68
-
69
-
70
-
71
-
72
-
73
-
74
-
75
-
76
-
77
-
78
-
79
-
80
-
81
-
82
-
83
-
84
-
85
-
86
-
87
-
88
-
89
-
90
-
91
-
92
-
93
-
94
-
95
-
96
-
97
-
98
-
99
-
100
-
101
-
102
-
103
-
104
-
105
-
106
-
107
-
108
-
109
-
110
-
111
-
112
-
113
-
114
-
115
-
116
-
117
 |
 |

36
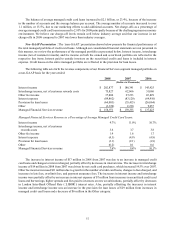
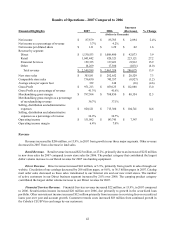
Financial Services Revenue – The components of Financial Services revenue on a generally accepted
accounting principles (“GAAP”) basis were as follows for the years ended:
2008 2007 2006
(In Thousands)
Interest and fee income, net of provision for loan losses $ 37,462 $28,974 $23,973
Interest expense (13,417)(7,288)(5,008)
Net interest income, net of provision for loan losses 24,045 21,686 18,965
Non-interest income:
Securitization income (including gains on sales of
credit card loans of $15,657, $22,740 and $17,410) 185,820 194,516 169,173
Other non-interest income 67,375 51,670 39,381
Total non-interest income 253,195 246,186 208,554
Less: Customer rewards costs (118,269)(108,537)(90,096)
Financial Services revenue $ 158,971 $159,335 $137,423
Financial Services revenue decreased 0.2% in 2008 compared to 2007. Credit card loans securitized and sold
are removed from our consolidated balance sheet, and the net earnings on these securitized assets, after paying
costs associated with outside investors, are reflected as a component of our securitization income shown above on a
GAAP basis. Net interest income includes operating results on the credit card loans receivable we own. Interest and
fee income increased $8 million primarily due to changes in the percentage of securitized loans we retained, changes
to interest and fees charged, and account growth, which was partially offset by decreases in interest rates. Other
non-interest income includes securitization income, gains on sales of loans, and income recognized on our retained
interests, as well as interchange income on the entire managed portfolio. Excluding the effect of the reduction of
gains on the sale of credit card loans, securitization income decreased $2 million from 2007, due primarily to changes
in the percentage of securitized loans we retained. Other non-interest income increased $16 million primarily from
increases in servicing fees on securitized loans year over year, changes in the percentage of securitized loans we
retained, interchange and other fee income, and account growth. Customer rewards costs increased $10 million from
continued growth in the Cabela’s CLUB Visa card usage by our customers.
Managed credit card loans of the Financial Services business segment include both credit card loans receivable
we own and securitized credit card loans in a separate trust that is not consolidated in our financial statements.
The process by which credit card loans are securitized converts interest income, interchange income, credit card
fees, credit losses, and other income and expenses on the securitized loans into securitization income. Because the
financial performance of the total managed portfolio has a significant impact on earnings we receive from servicing
the portfolio, management believes that evaluating the components of our Financial Services revenue for both owned
loans and securitized loans, as presented below in the non-GAAP presentation, is important to analyzing results.
Key statistics reflecting the performance of our Financial Services business are shown in the following chart
for the years ended:
2008 2007 Increase
(Decrease) % Change
(Dollars in Thousands Except Average Balance per Account )
Average balance of managed credit card loans $ 2,085,481 $1,690,543 $394,938 23.4%
Average number of active credit card accounts 1,140,834 987,411 153,423 15.5
Average balance per active credit card account $ 1,828 $1,712 $116 6.8
Net charge-offs on managed loans $ 61,448 $33,898 $27,550 81.3
Net charge-offs as a percentage of average
managed credit card loans 2.95%2.01%0.94%