Cabela's 2008 Annual Report Download - page 39
Download and view the complete annual report
Please find page 39 of the 2008 Cabela's annual report below. You can navigate through the pages in the report by either clicking on the pages listed below, or by using the keyword search tool below to find specific information within the annual report.-
 1
1 -
2
-
3
-
4
-
5
-
6
-
7
-
8
-
9
-
10
-
11
-
12
-
13
-
14
-
15
-
16
-
17
-
18
-
19
-
20
-
21
-
22
-
23
-
24
-
25
-
26
-
27
-
28
-
 29
29 -
 30
30 -
 31
31 -
 32
32 -
 33
33 -
 34
34 -
 35
35 -
 36
36 -
 37
37 -
 38
38 -
 39
39 -
 40
40 -
 41
41 -
 42
42 -
 43
43 -
 44
44 -
 45
45 -
 46
46 -
 47
47 -
 48
48 -
 49
49 -
50
-
51
-
52
-
53
-
54
-
55
-
56
-
57
-
58
-
59
-
60
-
61
-
62
-
63
-
64
-
65
-
66
-
67
-
68
-
69
-
70
-
71
-
72
-
73
-
74
-
75
-
76
-
77
-
78
-
79
-
80
-
81
-
82
-
83
-
84
-
85
-
86
-
87
-
88
-
89
-
90
-
91
-
92
-
93
-
94
-
95
-
96
-
97
-
98
-
99
-
100
-
101
-
102
-
103
-
104
-
105
-
106
-
107
-
108
-
109
-
110
-
111
-
112
-
113
-
114
-
115
-
116
-
117
 |
 |

34
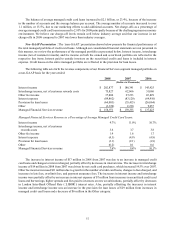
Operations Review
Our operating results expressed as a percentage of revenue were as follows for the years ended:
2008 2007 2006
Revenue 100.00%100.00%100.00%
Cost of revenue 60.34 58.66 58.37
Gross profit (exclusive of depreciation and amortization) 39.66 41.34 41.63
Selling, distribution, and administrative expenses 34.14 34.90 34.67
Operating income 5.52 6.44 6.96
Other income (expense):
Interest expense, net (1.16)(0.80)(0.78)
Other income, net 0.27 0.29 0.47
Total other income (expense), net (0.89)(0.51)(0.31)
Income before provision for income taxes 4.63 5.93 6.65
Provision for income taxes 1.64 2.19 2.49
Net income 2.99%3.74%4.16%
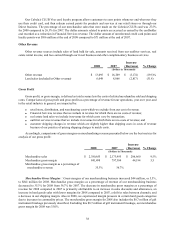
Results of Operations - 2008 Compared to 2007
Revenues
2008 %2007 %Increase
(Decrease) % Change
(Dollars in Thousands)
Retail $1,285,496 50.4% $ 1,043,442 44.4% $ 242,054 23.2%
Direct 1,095,159 42.9 1,130,553 48.1 (35,394)(3.1)
Financial Services 158,971 6.2 159,335 6.8 (364)(0.2)
Other 13,095 0.5 16,269 0.7 (3,174)(19.5)
$2,552,721 100.0% $ 2,349,599 100.0% $ 203,122 8.6%
For 2008, our Retail and Direct sales continued to be impacted by a challenging retail and macroeconomic
environment. Despite this challenging environment, revenue in our merchandising businesses increased in 2008
compared to 2007.
Product Sales Mix – Our five retail merchandise product categories, and the percentage of revenue contributed
by each, are presented in the following table for our Retail and Direct businesses and in total for the years ended:
Retail Direct Total
2008 2007 2008 2007 2008 2007
Hunting Equipment 41.6%38.7%27.3%26.6%35.2%32.6%
Fishing and Marine 15.3 15.6 11.0 12.3 13.4 14.0
Camping 12.9 12.9 16.2 15.4 14.3 14.1
Clothing and Footwear 25.2 27.0 35.9 36.3 30.0 31.7
Gifts and Furnishings 5.0 5.8 9.6 9.4 7.1 7.6
Total 100.0%100.0%100.0%100.0%100.0%100.0%