Electronic Arts 2005 Annual Report Download - page 113
Download and view the complete annual report
Please find page 113 of the 2005 Electronic Arts annual report below. You can navigate through the pages in the report by either clicking on the pages listed below, or by using the keyword search tool below to find specific information within the annual report.-
 1
1 -
2
-
3
-
4
-
5
-
6
-
7
-
8
-
9
-
10
-
11
-
12
-
13
-
14
-
15
-
16
-
17
-
18
-
19
-
20
-
21
-
22
-
23
-
24
-
25
-
26
-
27
-
28
-
29
-
30
-
31
-
32
-
33
-
34
-
35
-
36
-
37
-
38
-
39
-
40
-
41
-
42
-
43
-
44
-
45
-
46
-
47
-
48
-
49
-
50
-
51
-
52
-
53
-
54
-
55
-
56
-
57
-
58
-
59
-
60
-
61
-
62
-
63
-
64
-
65
-
66
-
67
-
68
-
69
-
70
-
71
-
72
-
73
-
74
-
75
-
76
-
77
-
78
-
79
-
80
-
81
-
82
-
83
-
84
-
85
-
86
-
87
-
88
-
89
-
90
-
91
-
92
-
93
-
94
-
95
-
96
-
97
-
98
-
99
-
100
-
101
-
102
-
 103
103 -
 104
104 -
 105
105 -
 106
106 -
 107
107 -
 108
108 -
 109
109 -
 110
110 -
 111
111 -
 112
112 -
 113
113 -
 114
114 -
 115
115 -
 116
116 -
 117
117 -
 118
118 -
 119
119 -
 120
120 -
 121
121 -
 122
122 -
 123
123 -
124
-
125
-
126
-
127
-
128
-
129
-
130
-
131
-
132
-
133
-
134
-
135
-
136
-
137
-
138
-
139
-
140
-
141
-
142
-
143
-
144
-
145
-
146
-
147
-
148
-
149
-
150
-
151
-
152
-
153
-
154
-
155
-
156
-
157
-
158
-
159
-
160
-
161
-
162
-
163
-
164
-
165
-
166
-
167
-
168
 |
 |

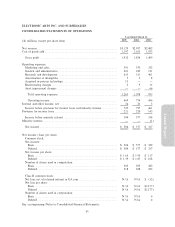
in stockholders' equity. Our portfolio of short-term investments consists of the following investment
categories, summarized by fair value as of March 31, 2005 and 2004 (in millions):
As of March 31,
2005 2004
U.S. government agencies ÏÏÏÏÏÏÏÏÏÏÏÏÏÏÏÏÏÏÏÏÏÏÏÏÏÏÏÏÏÏÏÏÏÏÏÏÏÏÏÏÏÏÏÏÏÏÏÏÏÏÏÏÏÏ $1,168 $264
U.S. government bonds ÏÏÏÏÏÏÏÏÏÏÏÏÏÏÏÏÏÏÏÏÏÏÏÏÏÏÏÏÏÏÏÏÏÏÏÏÏÏÏÏÏÏÏÏÏÏÏÏÏÏÏÏÏÏÏÏ 298 Ì
Corporate bonds ÏÏÏÏÏÏÏÏÏÏÏÏÏÏÏÏÏÏÏÏÏÏÏÏÏÏÏÏÏÏÏÏÏÏÏÏÏÏÏÏÏÏÏÏÏÏÏÏÏÏÏÏÏÏÏÏÏÏÏÏÏÏ 180 Ì
Asset-backed securitiesÏÏÏÏÏÏÏÏÏÏÏÏÏÏÏÏÏÏÏÏÏÏÏÏÏÏÏÏÏÏÏÏÏÏÏÏÏÏÏÏÏÏÏÏÏÏÏÏÏÏÏÏÏÏÏÏÏ 42 Ì
Total short-term investmentsÏÏÏÏÏÏÏÏÏÏÏÏÏÏÏÏÏÏÏÏÏÏÏÏÏÏÏÏÏÏÏÏÏÏÏÏÏÏÏÏÏÏÏÏÏÏÏÏÏÏ $1,688 $264
Notwithstanding our eÅorts to manage interest rate risks, there can be no assurances that we will be
adequately protected against risks associated with interest rate Öuctuations. At any time, a sharp rise in
interest rates could have a signiÑcant adverse impact on the fair value of our investment portfolio. The
following table presents the hypothetical changes in fair value in our short-term investment portfolio as of
March 31, 2005, arising from selected potential changes in interest rates. The modeling technique measures
the change in fair value from immediate hypothetical parallel shifts in the yield curve of plus or minus 50 basis
points (""BPS''), 100 BPS, and 150 BPS. Actual results may diÅer materially.
Valuation of Securities Given an
Fair Value
Valuation of Securities Given an Interest Interest Rate Increase of X
as of
Rate Decrease of X Basis Points Basis Points
March 31,(In millions) (150 BPS) (100 BPS) (50 BPS) 2005 50 BPS 100 BPS 150 BPS
U.S. government agencies ÏÏ $1,177 $1,175 $1,172 $1,168 $1,162 $1,156 $1,151
U.S. government bonds ÏÏÏ 306 303 300 298 295 293 290
Corporate bonds ÏÏÏÏÏÏÏÏÏ 185 184 182 180 178 177 175
Asset-backed securitiesÏÏÏÏ 44 43 43 42 42 41 41
Total short-term
investments ÏÏÏÏÏÏÏÏÏ $1,712 $1,705 $1,697 $1,688 $1,677 $1,667 $1,657
During Ñscal 2005, the composition of our portfolio of cash, cash equivalents and short-term investments
changed signiÑcantly from mostly cash equivalents during Ñscal 2004 to mostly short-term investments during
Ñscal 2005, as illustrated above, and is now more susceptible to changes in interest rates. Therefore, we have
changed our quantitative disclosures of interest rate risk from the tabular presentation used in prior years to
Annual Report
the sensitivity analysis, presented above, as we believe this methodology better illustrates the eÅects on our
portfolio caused by our primary risk of changes in interest rates. We have not presented a similar sensitivity
analysis for Ñscal 2004 because of the relatively insigniÑcant amount of short-term investments in Ñscal 2004
versus Ñscal 2005.
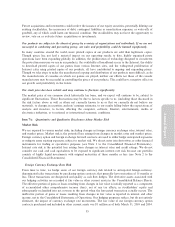
Market Price Risk
The values of our equity investments in publicly traded companies are subject to market price volatility. As of
March 31, 2005, our marketable equity securities were classiÑed as available-for-sale and, consequently, were
recorded in the Consolidated Balance Sheets at fair market value with unrealized gains or losses reported as a
separate component of accumulated other comprehensive income (loss), net of any tax eÅects, in stockhold-
ers' equity. The fair value of our marketable equity securities was $140 million and $1 million as of March 31,
2005 and 2004, respectively.
57