Electronic Arts 2005 Annual Report Download - page 93
Download and view the complete annual report
Please find page 93 of the 2005 Electronic Arts annual report below. You can navigate through the pages in the report by either clicking on the pages listed below, or by using the keyword search tool below to find specific information within the annual report.-
 1
1 -
2
-
3
-
4
-
5
-
6
-
7
-
8
-
9
-
10
-
11
-
12
-
13
-
14
-
15
-
16
-
17
-
18
-
19
-
20
-
21
-
22
-
23
-
24
-
25
-
26
-
27
-
28
-
29
-
30
-
31
-
32
-
33
-
34
-
35
-
36
-
37
-
38
-
39
-
40
-
41
-
42
-
43
-
44
-
45
-
46
-
47
-
48
-
49
-
50
-
51
-
52
-
53
-
54
-
55
-
56
-
57
-
58
-
59
-
60
-
61
-
62
-
63
-
64
-
65
-
66
-
67
-
68
-
69
-
70
-
71
-
72
-
73
-
74
-
75
-
76
-
77
-
78
-
79
-
80
-
81
-
82
-
 83
83 -
 84
84 -
 85
85 -
 86
86 -
 87
87 -
 88
88 -
 89
89 -
 90
90 -
 91
91 -
 92
92 -
 93
93 -
 94
94 -
 95
95 -
 96
96 -
 97
97 -
 98
98 -
 99
99 -
 100
100 -
 101
101 -
 102
102 -
 103
103 -
104
-
105
-
106
-
107
-
108
-
109
-
110
-
111
-
112
-
113
-
114
-
115
-
116
-
117
-
118
-
119
-
120
-
121
-
122
-
123
-
124
-
125
-
126
-
127
-
128
-
129
-
130
-
131
-
132
-
133
-
134
-
135
-
136
-
137
-
138
-
139
-
140
-
141
-
142
-
143
-
144
-
145
-
146
-
147
-
148
-
149
-
150
-
151
-
152
-
153
-
154
-
155
-
156
-
157
-
158
-
159
-
160
-
161
-
162
-
163
-
164
-
165
-
166
-
167
-
168
 |
 |

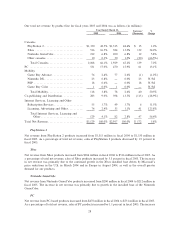
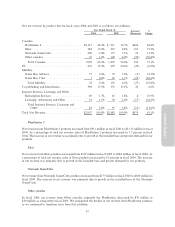
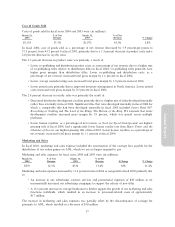
Cost of Goods Sold
Costs of goods sold for Ñscal years 2004 and 2003 were (in millions):
March 31, % of Net March 31, % of Net
2004 Revenue 2003 Revenue % Change
$1,103 37.3% $1,073 43.2% 2.8%
In Ñscal 2004, cost of goods sold as a percentage of net revenue decreased by 5.9 percentage points to
37.3 percent, from 43.2 percent for Ñscal 2003, primarily due to a 3.3 percent decrease in product costs and a
2.8 percent decrease in royalty rates.
The 3.3 percent decrease in product costs was primarily a result of:
‚ Lower co-publishing and distribution product costs, as a percentage of net revenue, due to a higher mix
of co-publishing titles relative to distribution titles in Ñscal 2004. Co-publishing titles generally have
higher gross margins than distribution titles. Lower co-publishing and distribution costs, as a
percentage of net revenue, increased total gross margin by 1.6 percent in Ñscal 2004.
‚ Lower average manufacturing costs increased total gross margin by 1.0 percent in Ñscal 2004.
‚ Lower period costs primarily due to improved inventory management in North America. Lower period
costs increased total gross margin by 0.5 percent in Ñscal 2004.
The 2.8 percent decrease in royalty rates was primarily the result of:
‚ Decreased third-party development royalties primarily due to a higher mix of titles developed internally
rather than externally in Ñscal 2004. SigniÑcant titles that were developed internally in Ñscal 2004 for
which a comparable title had been developed externally in Ñscal 2003 included James Bond 007:
Everything or Nothing and The Lord of the Rings; The Return of the King. We estimate that lower
development royalties increased gross margin by 1.9 percent, which was spread across multiple
platforms.
‚ Lower license royalties, as a percentage of net revenue, as Need for Speed Underground, our highest
grossing title of Ñscal 2004, had a signiÑcantly lower license royalty rate than Harry Potter and the
Chamber of Secrets, our highest grossing title of Ñscal 2003. Lower license royalties, as a percentage of
net revenue, increased total gross margin by 1.1 percent in Ñscal 2004.
Marketing and Sales
In Ñscal 2003, marketing and sales expense included the amortization of the carriage fees payable for the
Annual Report
distribution of our online games on AOL, which we are no longer required to pay.
Marketing and sales expenses for Ñscal years 2004 and 2003 were (in millions):
March 31, % of Net March 31, % of Net
2004 Revenue 2003 Revenue $ Change % Change
$370 12.5% $332 13.4% $38 11.4%
Marketing and sales expenses increased by 11.4 percent in Ñscal 2004 as compared to Ñscal 2003 primarily due
to:
‚ An increase in our advertising, contract services and promotional expenses of $38 million as we
incrementally increased our advertising campaigns to support the release of new titles.
‚ A 13.6 percent increase in average headcount to further support the growth of our marketing and sales
functions worldwide, which resulted in an increase to personnel-related costs of approximately
$17 million.
The increase in marketing and sales expenses was partially oÅset by the discontinuance of carriage fee
payments to AOL, which resulted in a decrease of $18 million.
37