Electronic Arts 2005 Annual Report Download - page 85
Download and view the complete annual report
Please find page 85 of the 2005 Electronic Arts annual report below. You can navigate through the pages in the report by either clicking on the pages listed below, or by using the keyword search tool below to find specific information within the annual report.-
 1
1 -
2
-
3
-
4
-
5
-
6
-
7
-
8
-
9
-
10
-
11
-
12
-
13
-
14
-
15
-
16
-
17
-
18
-
19
-
20
-
21
-
22
-
23
-
24
-
25
-
26
-
27
-
28
-
29
-
30
-
31
-
32
-
33
-
34
-
35
-
36
-
37
-
38
-
39
-
40
-
41
-
42
-
43
-
44
-
45
-
46
-
47
-
48
-
49
-
50
-
51
-
52
-
53
-
54
-
55
-
56
-
57
-
58
-
59
-
60
-
61
-
62
-
63
-
64
-
65
-
66
-
67
-
68
-
69
-
70
-
71
-
72
-
73
-
74
-
 75
75 -
 76
76 -
 77
77 -
 78
78 -
 79
79 -
 80
80 -
 81
81 -
 82
82 -
 83
83 -
 84
84 -
 85
85 -
 86
86 -
 87
87 -
 88
88 -
 89
89 -
 90
90 -
 91
91 -
 92
92 -
 93
93 -
 94
94 -
 95
95 -
96
-
97
-
98
-
99
-
100
-
101
-
102
-
103
-
104
-
105
-
106
-
107
-
108
-
109
-
110
-
111
-
112
-
113
-
114
-
115
-
116
-
117
-
118
-
119
-
120
-
121
-
122
-
123
-
124
-
125
-
126
-
127
-
128
-
129
-
130
-
131
-
132
-
133
-
134
-
135
-
136
-
137
-
138
-
139
-
140
-
141
-
142
-
143
-
144
-
145
-
146
-
147
-
148
-
149
-
150
-
151
-
152
-
153
-
154
-
155
-
156
-
157
-
158
-
159
-
160
-
161
-
162
-
163
-
164
-
165
-
166
-
167
-
168
 |
 |

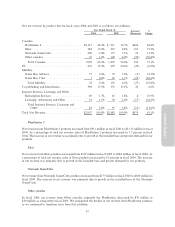
in PC net revenue was primarily due to higher sales of products in The Sims, Lord of the Rings and Need for
Speed franchises, partially oÅset by a decrease in sales of products in our Command and Conquer and
SimCity franchises.
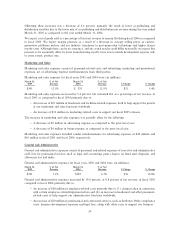
Mobility
Net revenue from mobile products increased from $78 million in Ñscal 2004 to $118 million in Ñscal 2005.
Mobile products include all mobile devices such as hand-helds and cellular handsets. The increase in mobility
net revenue was primarily due to the release of titles in conjunction with the launch of the Nintendo DS and
PSP platforms in North America and Japan.
Co-Publishing and Distribution
In Ñscal 2005, net revenue from co-publishing and distribution products decreased by $115 million to
$283 million as compared to Ñscal 2004. The decrease was primarily due to a signiÑcant decrease in the
number of co-publishing and distribution titles we released in Ñscal 2005. We released six co-publishing titles
in Ñscal 2005 as compared to 11 titles in Ñscal 2004.
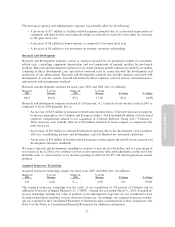
Subscription Services
In Ñscal 2005, net revenue from subscription services products increased by $6 million to $55 million as
compared to Ñscal 2004. The increase in net revenue was primarily due to an increase in the number of paying
subscribers to Club Pogo, partially oÅset by a decrease in subscription net revenue from Earth & Beyond
TM
and
The Sims
TM
Online subscription services.
Licensing, Advertising and Other
In Ñscal 2005, net revenue from licensing, advertising and other products increased by $41 million to
$74 million as compared to Ñscal 2004. The increase was primarily due to licensing revenue related to the
Nokia N-Gage platform.
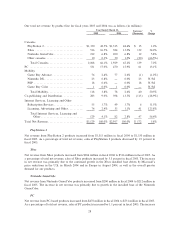
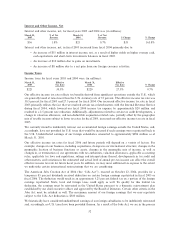
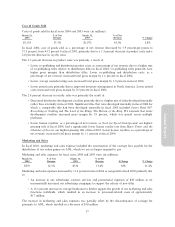
Cost of Goods Sold
Cost of goods sold for our disk-based and cartridge-based products consists of (1) product costs, (2) certain
royalty expenses for celebrities, professional sports and other organizations and independent software
Annual Report
developers, (3) manufacturing royalties, net of volume discounts, (4) expenses for defective products,
(5) write-oÅs of post-launch prepaid royalty costs, (6) amortization of certain intangible assets, and
(7) operations expenses. Cost of goods sold for our online product subscription business consists primarily of
data center and bandwidth costs associated with hosting our web sites, credit card fees and royalties for use of
third-party properties. Cost of goods sold for our web site advertising business primarily consists of ad-serving
costs.
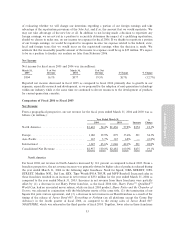
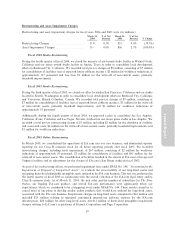
Costs of goods sold for Ñscal years 2005 and 2004 were (in millions):
March 31, % of Net March 31, % of Net
2005 Revenue 2004 Revenue % Change
$1,197 38.2% $1,103 37.3% 8.5%
In Ñscal 2005, cost of goods sold as a percentage of total net revenue increased 0.9 percent from 37.3 percent
to 38.2 percent. As a percentage of total net revenue, the increase was primarily due to a 2.3 percent increase
for: (1) pricing actions taken in both North America and Europe due to higher than anticipated channel
inventory, (2) inventory-related costs due to non-recurring rebates across several titles, and (3) incremental
costs incurred to produce our titles for the Nintendo DS and Sony PSP. In addition, warranty and online costs
increased by 0.8 percent.
29