Electronic Arts 2005 Annual Report Download - page 153
Download and view the complete annual report
Please find page 153 of the 2005 Electronic Arts annual report below. You can navigate through the pages in the report by either clicking on the pages listed below, or by using the keyword search tool below to find specific information within the annual report.-
 1
1 -
2
-
3
-
4
-
5
-
6
-
7
-
8
-
9
-
10
-
11
-
12
-
13
-
14
-
15
-
16
-
17
-
18
-
19
-
20
-
21
-
22
-
23
-
24
-
25
-
26
-
27
-
28
-
29
-
30
-
31
-
32
-
33
-
34
-
35
-
36
-
37
-
38
-
39
-
40
-
41
-
42
-
43
-
44
-
45
-
46
-
47
-
48
-
49
-
50
-
51
-
52
-
53
-
54
-
55
-
56
-
57
-
58
-
59
-
60
-
61
-
62
-
63
-
64
-
65
-
66
-
67
-
68
-
69
-
70
-
71
-
72
-
73
-
74
-
75
-
76
-
77
-
78
-
79
-
80
-
81
-
82
-
83
-
84
-
85
-
86
-
87
-
88
-
89
-
90
-
91
-
92
-
93
-
94
-
95
-
96
-
97
-
98
-
99
-
100
-
101
-
102
-
103
-
104
-
105
-
106
-
107
-
108
-
109
-
110
-
111
-
112
-
113
-
114
-
115
-
116
-
117
-
118
-
119
-
120
-
121
-
122
-
123
-
124
-
125
-
126
-
127
-
128
-
129
-
130
-
131
-
132
-
133
-
134
-
135
-
136
-
137
-
138
-
139
-
140
-
141
-
142
-
 143
143 -
 144
144 -
 145
145 -
 146
146 -
 147
147 -
 148
148 -
 149
149 -
 150
150 -
 151
151 -
 152
152 -
 153
153 -
 154
154 -
 155
155 -
 156
156 -
 157
157 -
 158
158 -
 159
159 -
 160
160 -
 161
161 -
 162
162 -
 163
163 -
164
-
165
-
166
-
167
-
168
 |
 |

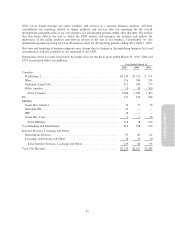
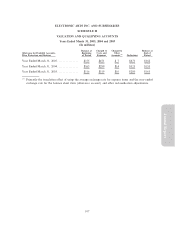
(18) QUARTERLY FINANCIAL AND MARKET INFORMATION (UNAUDITED)
Quarter Ended Year
June 30 Sept. 30 Dec. 31 March 31 Ended
(In millions, except per share data)
Fiscal 2005 Consolidated
Net revenue ÏÏÏÏÏÏÏÏÏÏÏÏÏÏÏÏÏÏÏÏÏÏÏÏÏÏÏÏÏÏÏÏÏÏÏÏÏ $ 432 $ 716 $1,428 $ 553 $3,129
Gross ProÑt ÏÏÏÏÏÏÏÏÏÏÏÏÏÏÏÏÏÏÏÏÏÏÏÏÏÏÏÏÏÏÏÏÏÏÏÏÏÏ 255 432 925 320 1,932
Operating income ÏÏÏÏÏÏÏÏÏÏÏÏÏÏÏÏÏÏÏÏÏÏÏÏÏÏÏÏÏÏÏÏÏ 25 125 519 Ì 669
Net income ÏÏÏÏÏÏÏÏÏÏÏÏÏÏÏÏÏÏÏÏÏÏÏÏÏÏÏÏÏÏÏÏÏÏÏÏÏÏ 24 97 375(a) 8(b) 504
Common Stock
Net income per share Ì basic ÏÏÏÏÏÏÏÏÏÏÏÏÏÏÏÏÏÏÏÏÏÏ $ 0.08 $ 0.32 $ 1.23 $ 0.02 $ 1.65
Net income per share Ì dilutedÏÏÏÏÏÏÏÏÏÏÏÏÏÏÏÏÏÏÏÏÏ $ 0.08 $ 0.31 $ 1.18 $ 0.02 $ 1.59
Common stock price per share
HighÏÏÏÏÏÏÏÏÏÏÏÏÏÏÏÏÏÏÏÏÏÏÏÏÏÏÏÏÏÏÏÏÏÏÏÏÏÏÏÏÏÏ $55.91 $55.01 $62.86 $71.16 $71.16
Low ÏÏÏÏÏÏÏÏÏÏÏÏÏÏÏÏÏÏÏÏÏÏÏÏÏÏÏÏÏÏÏÏÏÏÏÏÏÏÏÏÏÏ $47.42 $45.52 $43.38 $54.52 $43.38
Fiscal 2004 Consolidated
Net revenue ÏÏÏÏÏÏÏÏÏÏÏÏÏÏÏÏÏÏÏÏÏÏÏÏÏÏÏÏÏÏÏÏÏÏÏÏÏ $ 353 $ 530 $1,475 $ 599 $2,957
Gross ProÑt ÏÏÏÏÏÏÏÏÏÏÏÏÏÏÏÏÏÏÏÏÏÏÏÏÏÏÏÏÏÏÏÏÏÏÏÏÏÏ 203 316 962 373 1,854
Operating income ÏÏÏÏÏÏÏÏÏÏÏÏÏÏÏÏÏÏÏÏÏÏÏÏÏÏÏÏÏÏÏÏÏ 22 102 558 94 776
Net income ÏÏÏÏÏÏÏÏÏÏÏÏÏÏÏÏÏÏÏÏÏÏÏÏÏÏÏÏÏÏÏÏÏÏÏÏÏÏ 18 77(c) 392 90(d) 577
Common Stock
Net income per share Ì basic ÏÏÏÏÏÏÏÏÏÏÏÏÏÏÏÏÏÏÏÏÏÏ $ 0.06 $ 0.26 $ 1.32 $ 0.30 $ 1.95
Net income per share Ì dilutedÏÏÏÏÏÏÏÏÏÏÏÏÏÏÏÏÏÏÏÏÏ $ 0.06 $ 0.25 $ 1.26 $ 0.29 $ 1.87
Common stock price per share
HighÏÏÏÏÏÏÏÏÏÏÏÏÏÏÏÏÏÏÏÏÏÏÏÏÏÏÏÏÏÏÏÏÏÏÏÏÏÏÏÏÏÏ $39.70 $48.50 $52.89 $52.18 $52.89
Low ÏÏÏÏÏÏÏÏÏÏÏÏÏÏÏÏÏÏÏÏÏÏÏÏÏÏÏÏÏÏÏÏÏÏÏÏÏÏÏÏÏÏ $28.10 $36.55 $40.60 $43.43 $28.10
(a) Net income includes amortization of intangibles of $1 million, acquired in-process technology of $9 million
and employee stock-based compensation of $3 million, all net of taxes, and $3 million of non-deductible
acquisition related costs from our 100 percent acquisition of Criterion.
(b) Net income includes amortization of intangibles of $2 million, acquired in-process technology of $4 million
restructuring charges of $1 million, employee stock-based compensation of $1 million, $15 million for
certain litigation expenses and a bonus reversal of $18 million, all net of taxes.
(c) Net income includes amortization of intangibles of $1 million, net of taxes.
Annual Report
(d) Net income includes restructuring charges of $6 million, net of taxes and a reversal of previously accrued
income taxes of $20 million.
Our common stock is traded on the Nasdaq National Market under the symbol ERTS. The prices for the
common stock in the table above represent the high and low sales prices as reported on the Nasdaq National
Market.
97