Electronic Arts 2005 Annual Report Download - page 32
Download and view the complete annual report
Please find page 32 of the 2005 Electronic Arts annual report below. You can navigate through the pages in the report by either clicking on the pages listed below, or by using the keyword search tool below to find specific information within the annual report.-
 1
1 -
2
-
3
-
4
-
5
-
6
-
7
-
8
-
9
-
10
-
11
-
12
-
13
-
14
-
15
-
16
-
17
-
18
-
19
-
20
-
21
-
 22
22 -
 23
23 -
 24
24 -
 25
25 -
 26
26 -
 27
27 -
 28
28 -
 29
29 -
 30
30 -
 31
31 -
 32
32 -
 33
33 -
 34
34 -
 35
35 -
 36
36 -
 37
37 -
 38
38 -
 39
39 -
 40
40 -
 41
41 -
 42
42 -
43
-
44
-
45
-
46
-
47
-
48
-
49
-
50
-
51
-
52
-
53
-
54
-
55
-
56
-
57
-
58
-
59
-
60
-
61
-
62
-
63
-
64
-
65
-
66
-
67
-
68
-
69
-
70
-
71
-
72
-
73
-
74
-
75
-
76
-
77
-
78
-
79
-
80
-
81
-
82
-
83
-
84
-
85
-
86
-
87
-
88
-
89
-
90
-
91
-
92
-
93
-
94
-
95
-
96
-
97
-
98
-
99
-
100
-
101
-
102
-
103
-
104
-
105
-
106
-
107
-
108
-
109
-
110
-
111
-
112
-
113
-
114
-
115
-
116
-
117
-
118
-
119
-
120
-
121
-
122
-
123
-
124
-
125
-
126
-
127
-
128
-
129
-
130
-
131
-
132
-
133
-
134
-
135
-
136
-
137
-
138
-
139
-
140
-
141
-
142
-
143
-
144
-
145
-
146
-
147
-
148
-
149
-
150
-
151
-
152
-
153
-
154
-
155
-
156
-
157
-
158
-
159
-
160
-
161
-
162
-
163
-
164
-
165
-
166
-
167
-
168
 |
 |
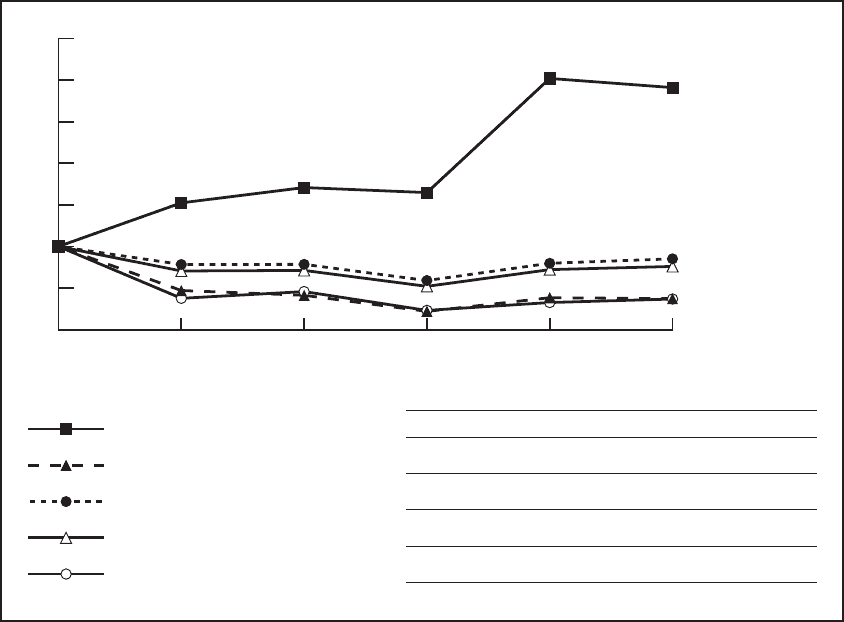
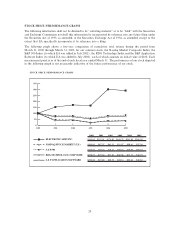
STOCK PRICE PERFORMANCE GRAPH
The following information shall not be deemed to be ""soliciting material'' or to be ""Ñled'' with the Securities
and Exchange Commission nor shall this information be incorporated by reference into any future Ñling under
the Securities Act of 1933, as amended, or the Securities Exchange Act of 1934, as amended, except to the
extent that EA speciÑcally incorporates it by reference into a Ñling.
The following graph shows a Ñve-year comparison of cumulative total returns during the period from
March 31, 2000 through March 31, 2005, for our common stock, the Nasdaq Market Composite Index, the
S&P 500 Index (to which EA was added in July 2002), the RDG Technology Index and the S&P Application
Software Index (to which EA was added in July 2002), each of which assumes an initial value of $100. Each
measurement point is as of the end of each Ñscal year ended March 31. The performance of our stock depicted
in the following graph is not necessarily indicative of the future performance of our stock.
STOCK PRICE PERFORMANCE GRAPH
S & P APPLICATION SOFTWARE
RDG TECHNOLOGY COMPOSITE
S & P 500
NASDAQ STOCK MARKET (U.S.)
ELECTRONIC ARTS INC.
2000 2001 2002 2003 2004 2005
$100.00 $152.41 $170.82 $164.75 $301.96 $290.95
$100.00 $47.07 $41.31 $21.97 $38.41 $37.26
$100.00 $78.32 $78.51 $59.07 $79.82 $85.16
$100.00 $70.54 $71.20 $52.06 $72.17 $76.00
$100.00 $37.69 $45.75 $23.14 $32.62 $36.82
3/053/043/033/023/013/00
0
50
100
150
200
250
300
350
20