Electronic Arts 2005 Annual Report Download - page 91
Download and view the complete annual report
Please find page 91 of the 2005 Electronic Arts annual report below. You can navigate through the pages in the report by either clicking on the pages listed below, or by using the keyword search tool below to find specific information within the annual report.-
 1
1 -
2
-
3
-
4
-
5
-
6
-
7
-
8
-
9
-
10
-
11
-
12
-
13
-
14
-
15
-
16
-
17
-
18
-
19
-
20
-
21
-
22
-
23
-
24
-
25
-
26
-
27
-
28
-
29
-
30
-
31
-
32
-
33
-
34
-
35
-
36
-
37
-
38
-
39
-
40
-
41
-
42
-
43
-
44
-
45
-
46
-
47
-
48
-
49
-
50
-
51
-
52
-
53
-
54
-
55
-
56
-
57
-
58
-
59
-
60
-
61
-
62
-
63
-
64
-
65
-
66
-
67
-
68
-
69
-
70
-
71
-
72
-
73
-
74
-
75
-
76
-
77
-
78
-
79
-
80
-
 81
81 -
 82
82 -
 83
83 -
 84
84 -
 85
85 -
 86
86 -
 87
87 -
 88
88 -
 89
89 -
 90
90 -
 91
91 -
 92
92 -
 93
93 -
 94
94 -
 95
95 -
 96
96 -
 97
97 -
 98
98 -
 99
99 -
 100
100 -
 101
101 -
102
-
103
-
104
-
105
-
106
-
107
-
108
-
109
-
110
-
111
-
112
-
113
-
114
-
115
-
116
-
117
-
118
-
119
-
120
-
121
-
122
-
123
-
124
-
125
-
126
-
127
-
128
-
129
-
130
-
131
-
132
-
133
-
134
-
135
-
136
-
137
-
138
-
139
-
140
-
141
-
142
-
143
-
144
-
145
-
146
-
147
-
148
-
149
-
150
-
151
-
152
-
153
-
154
-
155
-
156
-
157
-
158
-
159
-
160
-
161
-
162
-
163
-
164
-
165
-
166
-
167
-
168
 |
 |

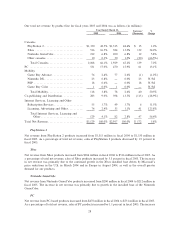
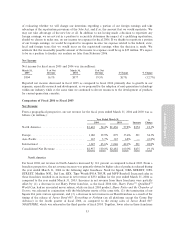
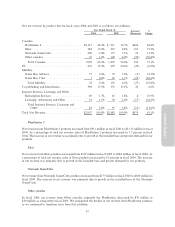
Our net revenue by product line for Ñscal years 2004 and 2003 is as follows (in millions):
Year Ended March 31, Increase/ %
2004 2003 (Decrease) Change
Consoles
PlayStation 2ÏÏÏÏÏÏÏÏÏÏÏÏÏÏÏÏÏÏÏÏÏÏÏÏÏÏÏÏ $1,315 44.4% $ 911 36.7% $404 44.4%
Xbox ÏÏÏÏÏÏÏÏÏÏÏÏÏÏÏÏÏÏÏÏÏÏÏÏÏÏÏÏÏÏÏÏÏÏ 384 13.0% 219 8.8% 165 75.2%
Nintendo GameCubeÏÏÏÏÏÏÏÏÏÏÏÏÏÏÏÏÏÏÏÏÏ 200 6.8% 177 7.1% 23 13.2%
Other consoles ÏÏÏÏÏÏÏÏÏÏÏÏÏÏÏÏÏÏÏÏÏÏÏÏÏÏ 30 1.0% 100 4.0% (70) (70.4%)
Total Consoles ÏÏÏÏÏÏÏÏÏÏÏÏÏÏÏÏÏÏÏÏÏÏÏÏ 1,929 65.2% 1,407 56.6% 522 37.1%
PC ÏÏÏÏÏÏÏÏÏÏÏÏÏÏÏÏÏÏÏÏÏÏÏÏÏÏÏÏÏÏÏÏÏÏÏÏÏÏ 470 15.9% 499 20.2% (29) (6.0%)
Mobility
Game Boy Advance ÏÏÏÏÏÏÏÏÏÏÏÏÏÏÏÏÏÏÏÏÏÏ 77 2.6% 79 3.2% (2) (2.3%)
Game Boy Color ÏÏÏÏÏÏÏÏÏÏÏÏÏÏÏÏÏÏÏÏÏÏÏÏ 1 0.0% 26 1.1% (25) (96.6%)
Total MobilityÏÏÏÏÏÏÏÏÏÏÏÏÏÏÏÏÏÏÏÏÏÏÏÏÏ 78 2.6% 105 4.3% (27) (25.8%)
Co-publishing and DistributionÏÏÏÏÏÏÏÏÏÏÏÏÏÏÏ 398 13.5% 376 15.1% 22 6.0%
Internet Services, Licensing and Other
Subscription Services ÏÏÏÏÏÏÏÏÏÏÏÏÏÏÏÏÏÏÏÏÏ 49 1.7% 45 1.8% 4 10.9%
Licensing, Advertising and OtherÏÏÏÏÏÏÏÏÏÏÏ 33 1.1% 50 2.0% (17) (34.3%)
Total Internet Services, Licensing and
Other ÏÏÏÏÏÏÏÏÏÏÏÏÏÏÏÏÏÏÏÏÏÏÏÏÏÏÏÏÏÏ 82 2.8% 95 3.8% (13) (13.0%)
Total Net RevenueÏÏÏÏÏÏÏÏÏÏÏÏÏÏÏÏÏÏÏÏÏÏÏÏÏ $2,957 100.0% $2,482 100.0% $475 19.1%
PlayStation 2
Net revenue from PlayStation 2 products increased from $911 million in Ñscal 2003 to $1,315 million in Ñscal
2004. As a percentage of total net revenue, sales of PlayStation 2 products increased by 7.7 percent in Ñscal
2004. The increase in net revenue was primarily due to growth in the installed base and greater demand for our
products.
Annual Report
Xbox
Net revenue from Xbox products increased from $219 million in Ñscal 2003 to $384 million in Ñscal 2004. As
a percentage of total net revenue, sales of Xbox products increased by 4.2 percent in Ñscal 2004. The increase
in net revenue was primarily due to growth in the installed base and greater demand for our products.
Nintendo GameCube
Net revenue from Nintendo GameCube products increased from $177 million in Ñscal 2003 to $200 million in
Ñscal 2004. The increase in net revenue was primarily due to growth in the installed base of the Nintendo
GameCube.
Other consoles
In Ñscal 2004, net revenue from Other consoles, primarily the PlayStation, decreased by $70 million to
$30 million as compared to Ñscal 2003. We anticipated the decline in net revenue from PlayStation products
as we continued to transition away from that platform.
35