Electronic Arts 2005 Annual Report Download - page 86
Download and view the complete annual report
Please find page 86 of the 2005 Electronic Arts annual report below. You can navigate through the pages in the report by either clicking on the pages listed below, or by using the keyword search tool below to find specific information within the annual report.-
 1
1 -
2
-
3
-
4
-
5
-
6
-
7
-
8
-
9
-
10
-
11
-
12
-
13
-
14
-
15
-
16
-
17
-
18
-
19
-
20
-
21
-
22
-
23
-
24
-
25
-
26
-
27
-
28
-
29
-
30
-
31
-
32
-
33
-
34
-
35
-
36
-
37
-
38
-
39
-
40
-
41
-
42
-
43
-
44
-
45
-
46
-
47
-
48
-
49
-
50
-
51
-
52
-
53
-
54
-
55
-
56
-
57
-
58
-
59
-
60
-
61
-
62
-
63
-
64
-
65
-
66
-
67
-
68
-
69
-
70
-
71
-
72
-
73
-
74
-
75
-
 76
76 -
 77
77 -
 78
78 -
 79
79 -
 80
80 -
 81
81 -
 82
82 -
 83
83 -
 84
84 -
 85
85 -
 86
86 -
 87
87 -
 88
88 -
 89
89 -
 90
90 -
 91
91 -
 92
92 -
 93
93 -
 94
94 -
 95
95 -
 96
96 -
97
-
98
-
99
-
100
-
101
-
102
-
103
-
104
-
105
-
106
-
107
-
108
-
109
-
110
-
111
-
112
-
113
-
114
-
115
-
116
-
117
-
118
-
119
-
120
-
121
-
122
-
123
-
124
-
125
-
126
-
127
-
128
-
129
-
130
-
131
-
132
-
133
-
134
-
135
-
136
-
137
-
138
-
139
-
140
-
141
-
142
-
143
-
144
-
145
-
146
-
147
-
148
-
149
-
150
-
151
-
152
-
153
-
154
-
155
-
156
-
157
-
158
-
159
-
160
-
161
-
162
-
163
-
164
-
165
-
166
-
167
-
168
 |
 |

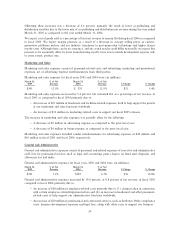
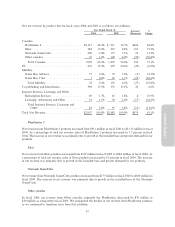
OÅsetting these increases was a decrease of 2.2 percent, primarily the result of lower co-publishing and
distribution royalties due to the lower mix of co-publishing and distribution net revenue during the year ended
March 31, 2005 as compared to the year ended March 31, 2004.
We expect cost of goods sold as a percentage of total net revenue to remain Öat during Ñscal 2006 as compared
to Ñscal 2005. We expect margin pressure as a result of a decrease in average selling prices as current-
generation platforms mature and our industry transitions to next-generation technology and higher license
royalty rates. Although there can be no assurance, and our actual results could diÅer materially, we expect this
pressure to be essentially oÅset by lower manufacturing royalty rates, lower outside development expense and,
to some extent, product mix.
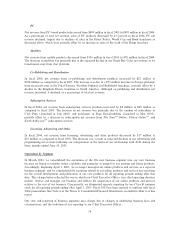
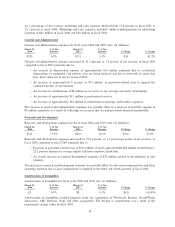
Marketing and Sales
Marketing and sales expenses consist of personnel-related costs and advertising, marketing and promotional
expenses, net of advertising expense reimbursements from third parties.
Marketing and sales expenses for Ñscal years 2005 and 2004 were (in millions):
March 31, % of Net March 31, % of Net
2005 Revenue 2004 Revenue $ Change % Change
$391 12.5% $ 370 12.5% $21 5.4%
Marketing and sales expenses increased by 5.4 percent, but remained Öat as a percentage of net revenue, in
Ñscal 2005 as compared to Ñscal 2004 primarily due to:
‚ An increase of $21 million in headcount and facilities-related expenses, both to help support the growth
of our marketing and sales functions worldwide.
‚ An increase of $12 million in marketing-related costs to support our Ñscal 2005 releases.
The increase in marketing and sales expenses was partially oÅset by the following:
‚ A decrease of $9 million in advertising expense as compared to the prior Ñscal year.
‚ A decrease of $4 million in bonus expense as compared to the prior Ñscal year.
Marketing and sales expenses included vendor reimbursements for advertising expenses of $42 million and
$45 million in Ñscal 2005 and Ñscal 2004, respectively.
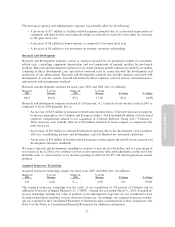
General and Administrative
General and administrative expenses consist of personnel and related expenses of executive and administrative
staÅ, fees for professional services such as legal and accounting, gains (losses) on Ñxed asset disposals, and
allowances for bad debts.
General and administrative expenses for Ñscal years 2005 and 2004 were (in millions):
March 31, % of Net March 31, % of Net
2005 Revenue 2004 Revenue $ Change % Change
$221 7.1% $185 6.3% $36 19.8%
General and administrative expenses increased by 19.8 percent, or 0.8 percent of net revenue, in Ñscal 2005
compared to Ñscal 2004 primarily due to:
‚ An increase of $48 million in employee-related costs primarily due to (1) charges taken in connection
with certain employee-related litigation matters and (2) an increase in headcount and other personnel-
related costs to help support our administrative functions worldwide.
‚ An increase of $20 million in professional and contracted services, such as Sarbanes-Oxley compliance
costs, business development expenses and legal fees, along with other costs to support our business.
30