Electronic Arts 2005 Annual Report Download - page 149
Download and view the complete annual report
Please find page 149 of the 2005 Electronic Arts annual report below. You can navigate through the pages in the report by either clicking on the pages listed below, or by using the keyword search tool below to find specific information within the annual report.-
 1
1 -
2
-
3
-
4
-
5
-
6
-
7
-
8
-
9
-
10
-
11
-
12
-
13
-
14
-
15
-
16
-
17
-
18
-
19
-
20
-
21
-
22
-
23
-
24
-
25
-
26
-
27
-
28
-
29
-
30
-
31
-
32
-
33
-
34
-
35
-
36
-
37
-
38
-
39
-
40
-
41
-
42
-
43
-
44
-
45
-
46
-
47
-
48
-
49
-
50
-
51
-
52
-
53
-
54
-
55
-
56
-
57
-
58
-
59
-
60
-
61
-
62
-
63
-
64
-
65
-
66
-
67
-
68
-
69
-
70
-
71
-
72
-
73
-
74
-
75
-
76
-
77
-
78
-
79
-
80
-
81
-
82
-
83
-
84
-
85
-
86
-
87
-
88
-
89
-
90
-
91
-
92
-
93
-
94
-
95
-
96
-
97
-
98
-
99
-
100
-
101
-
102
-
103
-
104
-
105
-
106
-
107
-
108
-
109
-
110
-
111
-
112
-
113
-
114
-
115
-
116
-
117
-
118
-
119
-
120
-
121
-
122
-
123
-
124
-
125
-
126
-
127
-
128
-
129
-
130
-
131
-
132
-
133
-
134
-
135
-
136
-
137
-
138
-
 139
139 -
 140
140 -
 141
141 -
 142
142 -
 143
143 -
 144
144 -
 145
145 -
 146
146 -
 147
147 -
 148
148 -
 149
149 -
 150
150 -
 151
151 -
 152
152 -
 153
153 -
 154
154 -
 155
155 -
 156
156 -
 157
157 -
 158
158 -
 159
159 -
160
-
161
-
162
-
163
-
164
-
165
-
166
-
167
-
168
 |
 |

The change in unrealized gains (losses) on investments, net are shown net of taxes of $1 million in both Ñscal
years 2005 and 2003. The change in unrealized gains on investments, net for Ñscal 2004 was not material. In
each of the last three years, activity related to derivatives has not been material.
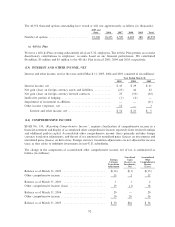
(15) NET INCOME (LOSS) PER SHARE
The following table summarizes the computations of basic earnings per share (""Basic EPS'') and diluted
earnings per share (""Diluted EPS''). Basic EPS is computed as net income divided by the weighted-average
number of common shares outstanding for the period. Diluted EPS reÖects the potential dilution that could
occur from common shares issuable through stock-based compensation plans including stock options,
restricted stock awards, warrants and other convertible securities using the treasury stock method. EÅective
August 2, 2004, each outstanding share of Class A common stock was reclassiÑed as one share of common
stock and prior year Class A common stock has been reclassiÑed to reÖect these amendments. See Note 11 in
the Notes to Consolidated Financial Statements.
Year Ended March 31
2005 2004
(In millions, except per share amounts)
Net income ÏÏÏÏÏÏÏÏÏÏÏÏÏÏÏÏÏÏÏÏÏÏÏÏÏÏÏÏÏÏÏÏÏÏÏÏÏÏÏÏÏÏÏÏÏÏÏÏÏÏÏÏÏÏÏÏÏÏÏÏÏÏ $ 504 $ 577
Shares used to compute net income per share:
Weighted-average common stock outstanding Ì basic ÏÏÏÏÏÏÏÏÏÏÏÏÏÏÏÏÏÏÏÏÏÏÏÏ 305 295
Dilutive common stock equivalents ÏÏÏÏÏÏÏÏÏÏÏÏÏÏÏÏÏÏÏÏÏÏÏÏÏÏÏÏÏÏÏÏÏÏÏÏÏÏÏÏ 13 13
Weighted-average common stock outstanding Ì diluted ÏÏÏÏÏÏÏÏÏÏÏÏÏÏÏÏÏÏÏÏÏÏÏÏÏ 318 308
Net income per share:
BasicÏÏÏÏÏÏÏÏÏÏÏÏÏÏÏÏÏÏÏÏÏÏÏÏÏÏÏÏÏÏÏÏÏÏÏÏÏÏÏÏÏÏÏÏÏÏÏÏÏÏÏÏÏÏÏÏÏÏÏÏÏÏÏÏÏÏ $1.65 $1.95
Diluted ÏÏÏÏÏÏÏÏÏÏÏÏÏÏÏÏÏÏÏÏÏÏÏÏÏÏÏÏÏÏÏÏÏÏÏÏÏÏÏÏÏÏÏÏÏÏÏÏÏÏÏÏÏÏÏÏÏÏÏÏÏÏÏÏ $1.59 $1.87
Year Ended March 31, 2003
Common Common Class B
Stock Ì Stock Ì Common
Basic Diluted Stock
(In millions, except per share amounts)
Net income (loss) before retained interest in EA.comÏÏÏÏÏÏÏÏÏÏÏÏÏÏÏ $ 474 $ 317 $ (157)
Net loss related to retained interest in EA.comÏÏÏÏÏÏÏÏÏÏÏÏÏÏÏÏÏÏÏÏÏ (145) Ì 145
Annual Report
Net income (loss)ÏÏÏÏÏÏÏÏÏÏÏÏÏÏÏÏÏÏÏÏÏÏÏÏÏÏÏÏÏÏÏÏÏÏÏÏÏÏÏÏÏÏÏÏÏ $ 329 $ 317 $ (12)
Shares used to compute net income (loss) per share:
Weighted-average common stock outstanding Ì basic ÏÏÏÏÏÏÏÏÏÏÏÏÏ 282 282 4
Dilutive common stock equivalents ÏÏÏÏÏÏÏÏÏÏÏÏÏÏÏÏÏÏÏÏÏÏÏÏÏÏÏÏÏ Ì 11 Ì
Weighted-average common shares outstanding Ì diluted ÏÏÏÏÏÏÏÏÏÏÏÏ 282 293 4
Net income (loss) per share:
Basic ÏÏÏÏÏÏÏÏÏÏÏÏÏÏÏÏÏÏÏÏÏÏÏÏÏÏÏÏÏÏÏÏÏÏÏÏÏÏÏÏÏÏÏÏÏÏÏÏÏÏÏÏÏÏ $ 1.17 N/A $(2.77)
Diluted ÏÏÏÏÏÏÏÏÏÏÏÏÏÏÏÏÏÏÏÏÏÏÏÏÏÏÏÏÏÏÏÏÏÏÏÏÏÏÏÏÏÏÏÏÏÏÏÏÏÏÏÏ N/A $1.08 $(2.77)
Excluded from the above computation of weighted-average common stock for Diluted EPS for the Ñscal years
ended March 31, 2005, 2004 and 2003 were options to purchase 1 million, 3 million and 6 million shares of
common stock, respectively, as the options' exercise price was greater than the average market price of the
common stock. For Ñscal 2005, 2004 and 2003, the weighted-average exercise price of these options was
$63.63, $47.19 and $31.16 per share, respectively.
93