Electronic Arts 2005 Annual Report Download - page 94
Download and view the complete annual report
Please find page 94 of the 2005 Electronic Arts annual report below. You can navigate through the pages in the report by either clicking on the pages listed below, or by using the keyword search tool below to find specific information within the annual report.-
 1
1 -
2
-
3
-
4
-
5
-
6
-
7
-
8
-
9
-
10
-
11
-
12
-
13
-
14
-
15
-
16
-
17
-
18
-
19
-
20
-
21
-
22
-
23
-
24
-
25
-
26
-
27
-
28
-
29
-
30
-
31
-
32
-
33
-
34
-
35
-
36
-
37
-
38
-
39
-
40
-
41
-
42
-
43
-
44
-
45
-
46
-
47
-
48
-
49
-
50
-
51
-
52
-
53
-
54
-
55
-
56
-
57
-
58
-
59
-
60
-
61
-
62
-
63
-
64
-
65
-
66
-
67
-
68
-
69
-
70
-
71
-
72
-
73
-
74
-
75
-
76
-
77
-
78
-
79
-
80
-
81
-
82
-
83
-
 84
84 -
 85
85 -
 86
86 -
 87
87 -
 88
88 -
 89
89 -
 90
90 -
 91
91 -
 92
92 -
 93
93 -
 94
94 -
 95
95 -
 96
96 -
 97
97 -
 98
98 -
 99
99 -
 100
100 -
 101
101 -
 102
102 -
 103
103 -
 104
104 -
105
-
106
-
107
-
108
-
109
-
110
-
111
-
112
-
113
-
114
-
115
-
116
-
117
-
118
-
119
-
120
-
121
-
122
-
123
-
124
-
125
-
126
-
127
-
128
-
129
-
130
-
131
-
132
-
133
-
134
-
135
-
136
-
137
-
138
-
139
-
140
-
141
-
142
-
143
-
144
-
145
-
146
-
147
-
148
-
149
-
150
-
151
-
152
-
153
-
154
-
155
-
156
-
157
-
158
-
159
-
160
-
161
-
162
-
163
-
164
-
165
-
166
-
167
-
168
 |
 |

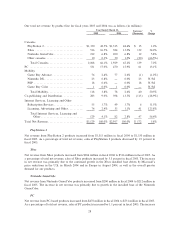
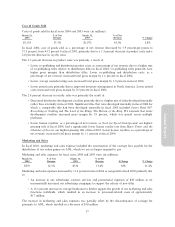
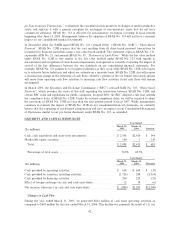
As a percentage of net revenue, marketing and sales expenses declined from 13.4 percent in Ñscal 2003 to
12.5 percent in Ñscal 2004. Marketing and sales expenses included vendor reimbursements for advertising
expenses of $45 million in Ñscal 2004 and $28 million in Ñscal 2003.
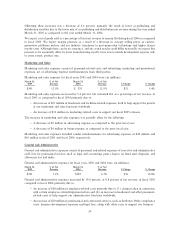
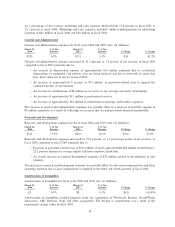
General and Administrative
General and administrative expenses for Ñscal years 2004 and 2003 were (in millions):
March 31, % of Net March 31, % of Net
2004 Revenue 2003 Revenue $ Change % Change
$185 6.3% $131 5.3% $54 41.2%
General and administrative expenses increased by 41.2 percent, or 1.0 percent of net revenue, in Ñscal 2004
compared to Ñscal 2003 primarily due to:
‚ An increase in depreciation expense of approximately $18 million primarily due to accelerated
depreciation on equipment and software that are being replaced and due to write-oÅs of assets that
have been taken out of service in Ñscal 2004.
‚ An increase of approximately 9 percent, or $15 million, in personnel-related costs to support the
continued growth of our business.
‚ An increase in contributions of $8 million as we invest in our strategic university relationships.
‚ An increase of approximately $11 million in professional services.
‚ An increase of approximately $10 million in information technology and facilities expenses.
The increase in general and administrative expenses was partially oÅset by a decrease in bad debt expense of
$9 million, primarily as a result of collecting on accounts that we had previously deemed uncollectible.
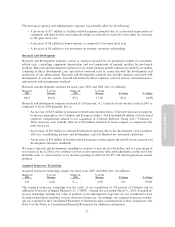
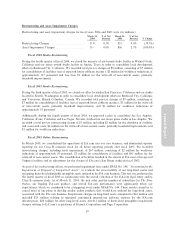
Research and Development
Research and development expenses for Ñscal years 2004 and 2003 were (in millions):
March 31, % of Net March 31, % of Net
2004 Revenue 2003 Revenue $ Change % Change
$511 17.3% $401 16.1% $110 27.4%
Research and development expenses increased by 27.4 percent, or 1.2 percentage points of net revenue, in
Ñscal 2004 compared to Ñscal 2003 primarily due to:
‚ Increases in personnel-related costs of $101 million of which approximately $64 million resulted from a
22.2 percent increase in average regular full-time employee headcount.
‚ An overall increase in external development expenses of $23 million related to development of new
products.
The increase in research and development expenses was partially oÅset by a decrease in depreciation and other
operating expenses due to asset impairments recognized in the third and fourth quarters of Ñscal 2003.
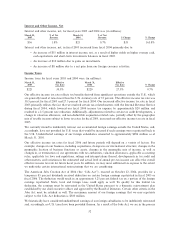
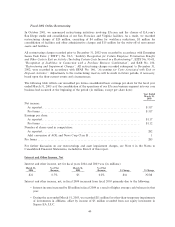
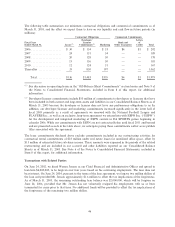
Amortization of Intangibles
Amortization of intangibles for Ñscal years 2004 and 2003 was (in millions):
March 31, % of Net March 31, % of Net
2004 Revenue 2003 Revenue $ Change % Change
$3 0.1% $8 0.3% $(5) (63.4%)
Amortization of intangibles resulted primarily from our acquisitions of Westwood, Kesmai, DreamWorks
Interactive, ABC Software, Pogo and other acquisitions. The decline in amortization was a result of the
impairment charges taken in Ñscal 2003.
38