Electronic Arts 2005 Annual Report Download - page 87
Download and view the complete annual report
Please find page 87 of the 2005 Electronic Arts annual report below. You can navigate through the pages in the report by either clicking on the pages listed below, or by using the keyword search tool below to find specific information within the annual report.-
 1
1 -
2
-
3
-
4
-
5
-
6
-
7
-
8
-
9
-
10
-
11
-
12
-
13
-
14
-
15
-
16
-
17
-
18
-
19
-
20
-
21
-
22
-
23
-
24
-
25
-
26
-
27
-
28
-
29
-
30
-
31
-
32
-
33
-
34
-
35
-
36
-
37
-
38
-
39
-
40
-
41
-
42
-
43
-
44
-
45
-
46
-
47
-
48
-
49
-
50
-
51
-
52
-
53
-
54
-
55
-
56
-
57
-
58
-
59
-
60
-
61
-
62
-
63
-
64
-
65
-
66
-
67
-
68
-
69
-
70
-
71
-
72
-
73
-
74
-
75
-
76
-
 77
77 -
 78
78 -
 79
79 -
 80
80 -
 81
81 -
 82
82 -
 83
83 -
 84
84 -
 85
85 -
 86
86 -
 87
87 -
 88
88 -
 89
89 -
 90
90 -
 91
91 -
 92
92 -
 93
93 -
 94
94 -
 95
95 -
 96
96 -
 97
97 -
98
-
99
-
100
-
101
-
102
-
103
-
104
-
105
-
106
-
107
-
108
-
109
-
110
-
111
-
112
-
113
-
114
-
115
-
116
-
117
-
118
-
119
-
120
-
121
-
122
-
123
-
124
-
125
-
126
-
127
-
128
-
129
-
130
-
131
-
132
-
133
-
134
-
135
-
136
-
137
-
138
-
139
-
140
-
141
-
142
-
143
-
144
-
145
-
146
-
147
-
148
-
149
-
150
-
151
-
152
-
153
-
154
-
155
-
156
-
157
-
158
-
159
-
160
-
161
-
162
-
163
-
164
-
165
-
166
-
167
-
168
 |
 |

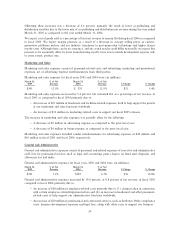
The increase in general and administrative expenses was partially oÅset by the following:
‚ A decrease of $17 million in facilities-related expenses primarily due to accelerated depreciation on
equipment and software that were replaced and due to write-oÅs of assets that were taken out of service
in the prior Ñscal year.
‚ A decrease of $8 million in bonus expense as compared to the prior Ñscal year.
‚ A decrease of $8 million in our investment in strategic university relationships.
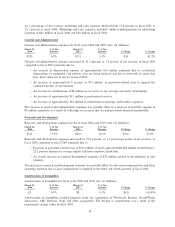
Research and Development
Research and development expenses consist of expenses incurred by our production studios for personnel-
related costs, consulting, equipment depreciation and any impairment of prepaid royalties for pre-launch
products. Research and development expenses for our online business include expenses incurred by our studios
consisting of direct development costs and related overhead costs in connection with the development and
production of our online games. Research and development expenses also include expenses associated with
development of web site content, network infrastructure direct expenses, software licenses and maintenance,
and network and management overhead.
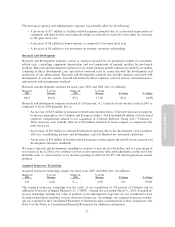
Research and development expenses for Ñscal years 2005 and 2004 were (in millions):
March 31, % of Net March 31, % of Net
2005 Revenue 2004 Revenue $ Change % Change
$633 20.2% $511 17.3% $122 24.0%
Research and development expenses increased by 24.0 percent, or 2.9 percent of net revenue, in Ñscal 2005 as
compared to Ñscal 2004 primarily due to:
‚ An increase of $103 million in personnel-related costs resulting from a 30 percent increase in employee
headcount primarily in our Canadian and European studios, which included $6 million of stock-based
employee compensation related to our acquisition of Criterion Software Group Ltd (""Criterion'').
These increases were partially oÅset by a $20 million reduction in bonus expense as compared to the
prior Ñscal year.
‚ An increase of $19 million in external development expenses due to the development of new products
with our co-publishing partners and development costs for Renderware and mobile platforms.
‚ An increase of $18 million in facilities-related expenses to help support the growth of our research and
development functions worldwide.
Annual Report
We expect research and development spending to continue to increase in total dollars and as a percentage of
net revenue in Ñscal 2006 as we continue to invest in next-generation tools and technologies, products for new
platforms, and, to a lesser extent, as we increase spending on titles for the PC and current-generation console
products.
Acquired In-process Technology
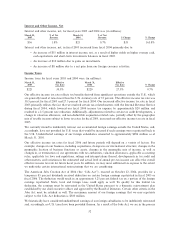
Acquired in-process technology charges for Ñscal years 2005 and 2004 were (in millions):
March 31, % of Net March 31, % of Net
2005 Revenue 2004 Revenue $ Change % Change
$13 0.4% $ Ì 0.0% $13 N/M
The acquired in-process technology was the result of our acquisitions of 100 percent of Criterion and an
additional 44 percent of Digital Illusions C.E. (""DICE'') during the year ended March 31, 2005. Acquired in-
process technology includes the value of products in the development stage that are not considered to have
reached technological feasibility or have alternative future use. Accordingly, the acquired in-process technol-
ogy was expensed in the Consolidated Statement of Operations upon consummation of these acquisitions. See
Note 4 of the Notes to Consolidated Financial Statements for additional information.
31