Electronic Arts 2005 Annual Report Download - page 77
Download and view the complete annual report
Please find page 77 of the 2005 Electronic Arts annual report below. You can navigate through the pages in the report by either clicking on the pages listed below, or by using the keyword search tool below to find specific information within the annual report.-
 1
1 -
2
-
3
-
4
-
5
-
6
-
7
-
8
-
9
-
10
-
11
-
12
-
13
-
14
-
15
-
16
-
17
-
18
-
19
-
20
-
21
-
22
-
23
-
24
-
25
-
26
-
27
-
28
-
29
-
30
-
31
-
32
-
33
-
34
-
35
-
36
-
37
-
38
-
39
-
40
-
41
-
42
-
43
-
44
-
45
-
46
-
47
-
48
-
49
-
50
-
51
-
52
-
53
-
54
-
55
-
56
-
57
-
58
-
59
-
60
-
61
-
62
-
63
-
64
-
65
-
66
-
 67
67 -
 68
68 -
 69
69 -
 70
70 -
 71
71 -
 72
72 -
 73
73 -
 74
74 -
 75
75 -
 76
76 -
 77
77 -
 78
78 -
 79
79 -
 80
80 -
 81
81 -
 82
82 -
 83
83 -
 84
84 -
 85
85 -
 86
86 -
 87
87 -
88
-
89
-
90
-
91
-
92
-
93
-
94
-
95
-
96
-
97
-
98
-
99
-
100
-
101
-
102
-
103
-
104
-
105
-
106
-
107
-
108
-
109
-
110
-
111
-
112
-
113
-
114
-
115
-
116
-
117
-
118
-
119
-
120
-
121
-
122
-
123
-
124
-
125
-
126
-
127
-
128
-
129
-
130
-
131
-
132
-
133
-
134
-
135
-
136
-
137
-
138
-
139
-
140
-
141
-
142
-
143
-
144
-
145
-
146
-
147
-
148
-
149
-
150
-
151
-
152
-
153
-
154
-
155
-
156
-
157
-
158
-
159
-
160
-
161
-
162
-
163
-
164
-
165
-
166
-
167
-
168
 |
 |

Item 7: Management's Discussion and Analysis of Financial Condition and Results of Operation
OVERVIEW
The following overview is a top-level discussion of our operating results as well as some of the trends and
drivers that aÅect our business. Management believes that an understanding of these trends and drivers is
important in order to understand our results for Ñscal 2005, as well as our future prospects. This summary is
not intended to be exhaustive, nor is it intended to be a substitute for the detailed discussion and analysis
provided elsewhere in this Form 10-K, including in ""Business'', the remainder of ""Management's Discussion
and Analysis of Financial Condition and Results of Operations'', ""Risk Factors'' or the consolidated Ñnancial
statements and related notes.
About Electronic Arts
We develop, market, publish and distribute interactive software games that are playable by consumers on
home video game consoles (such as the Sony PlayStation 2, Microsoft Xbox and Nintendo GameCube
consoles), personal computers, mobile platforms Ì including hand-held game players (such as the Game Boy
Advance, Nintendo DS and Sony PSP) and cellular handsets Ì and online, over the Internet and other
proprietary online networks. Some of our games are based on content that we license from others (e.g.,
Madden NFL Football, Harry Potter and FIFA Soccer), and some of our games are based on our own wholly-
owned intellectual property (e.g., The Sims and Need for Speed). Our goal is to develop titles which appeal to
the mass markets, which often means translating and localizing them for sale in non-English speaking
countries. In addition, we also attempt to create software game ""franchises'' that allow us to publish new titles
on a recurring basis that are based on the same property. Examples of this are the annual iterations of our
sports-based franchises (e.g., NCAA Football and FIFA Soccer), titles based on long-lived movie properties
(e.g., James Bond and Harry Potter) and wholly-owned properties that can be successfully sequeled (e.g., The
Sims and Need for Speed).
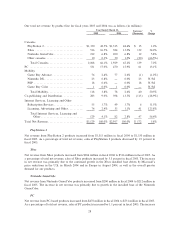
Overview of Financial Results
Total net revenue for the Ñscal year ended March 31, 2005 was $3.129 billion, up 5.8 percent, as compared to
the Ñscal year ended March 31, 2004. Six franchises sold more than Ñve million units in the Ñscal year ended
March 31, 2005: The Sims, Need for Speed, Madden, FIFA, The Lord of the Rings and Harry Potter. We
published three titles each on the Nintendo DS and the Sony PSP, two new platforms released during the year
ended March 31, 2005. Net revenue on these platforms increased our net revenue by approximately
$41 million and we expect to continue to develop titles for both platforms in Ñscal 2006.
Net income for the Ñscal year ended March 31, 2005 was $504 million, a 12.7 percent decrease as compared to
the Ñscal year ended March 31, 2004 and diluted earnings per share were $1.59 as compared with $1.87 for the
Annual Report
prior year.
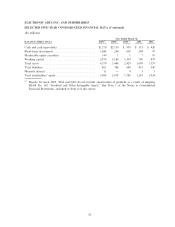
We generated $634 million in cash from operations during the year ended March 31, 2005 as compared to
$669 million in the Ñscal year ended March 31, 2004. The decrease in cash Öow was primarily the result of
(1) our overall decline in net income for Ñscal 2005, (2) higher accounts receivable balances due to the timing
of sales in the fourth quarter of Ñscal 2005 and (3) higher cash payments for income taxes. These declines
were partially oÅset by higher balances in our current liabilities.
Management's Overview of Historical and Prospective Business Trends
Transition to Next-Generation Consoles. Our industry is cyclical and we believe it has entered into a
transition stage heading into the next cycle. Over the course of the next eighteen months, we expect Sony,
Microsoft and Nintendo to introduce new video game consoles into the market. During this transition, we
intend to continue developing new titles for the current generation of video game consoles while we also make
signiÑcant investments as we prepare to introduce products that operate on the next-generation consoles. We
have and expect to continue to incur higher costs during this transition to next-generation consoles. We also
expect development costs for next-generation video games to be greater on a per-title basis than development
costs for current-generation video games. In addition, sales of video games for current generation consoles may
begin to decline and consumers may defer game software purchases until the next-generation consoles become
21