Electronic Arts 2005 Annual Report Download - page 98
Download and view the complete annual report
Please find page 98 of the 2005 Electronic Arts annual report below. You can navigate through the pages in the report by either clicking on the pages listed below, or by using the keyword search tool below to find specific information within the annual report.-
 1
1 -
2
-
3
-
4
-
5
-
6
-
7
-
8
-
9
-
10
-
11
-
12
-
13
-
14
-
15
-
16
-
17
-
18
-
19
-
20
-
21
-
22
-
23
-
24
-
25
-
26
-
27
-
28
-
29
-
30
-
31
-
32
-
33
-
34
-
35
-
36
-
37
-
38
-
39
-
40
-
41
-
42
-
43
-
44
-
45
-
46
-
47
-
48
-
49
-
50
-
51
-
52
-
53
-
54
-
55
-
56
-
57
-
58
-
59
-
60
-
61
-
62
-
63
-
64
-
65
-
66
-
67
-
68
-
69
-
70
-
71
-
72
-
73
-
74
-
75
-
76
-
77
-
78
-
79
-
80
-
81
-
82
-
83
-
84
-
85
-
86
-
87
-
 88
88 -
 89
89 -
 90
90 -
 91
91 -
 92
92 -
 93
93 -
 94
94 -
 95
95 -
 96
96 -
 97
97 -
 98
98 -
 99
99 -
 100
100 -
 101
101 -
 102
102 -
 103
103 -
 104
104 -
 105
105 -
 106
106 -
 107
107 -
 108
108 -
109
-
110
-
111
-
112
-
113
-
114
-
115
-
116
-
117
-
118
-
119
-
120
-
121
-
122
-
123
-
124
-
125
-
126
-
127
-
128
-
129
-
130
-
131
-
132
-
133
-
134
-
135
-
136
-
137
-
138
-
139
-
140
-
141
-
142
-
143
-
144
-
145
-
146
-
147
-
148
-
149
-
150
-
151
-
152
-
153
-
154
-
155
-
156
-
157
-
158
-
159
-
160
-
161
-
162
-
163
-
164
-
165
-
166
-
167
-
168
 |
 |

for Non-monetary Transactions'', to eliminate the exception for non-monetary exchanges of similar productive
assets and replaces it with a general exception for exchanges of non-monetary assets that do not have
commercial substance. SFAS No. 153 is eÅective for non-monetary exchanges occurring in Ñscal periods
beginning after June 15, 2005. Management believes the adoption of SFAS No. 153 will not have a material
impact on our consolidated Ñnancial statements.
In December 2004, the FASB issued SFAS No. 123 (revised 2004) (""SFAS No. 123R''), ""Share-Based
Payment''. SFAS No. 123R requires that the cost resulting from all share-based payment transactions be
recognized in Ñnancial statements using a fair-value-based method. The statement replaces SFAS No. 123,
supersedes APB No. 25, and amends SFAS No. 95, ""Statement of Cash Flows''. While the fair value method
under SFAS No. 123R is very similar to the fair value method under SFAS No. 123 with regards to
measurement and recognition of stock-based compensation, management is currently evaluating the impact of
several of the key diÅerences between the two standards on our consolidated Ñnancial statements. For
example, SFAS No. 123 permits us to recognize forfeitures as they occur while SFAS No. 123R will require
us to estimate future forfeitures and adjust our estimate on a quarterly basis. SFAS No. 123R also will require
a classiÑcation change in the statement of cash Öows, whereby a portion of the tax beneÑt from stock options
will move from operating cash Öow activities to Ñnancing cash Öow activities (total cash Öows will remain
unchanged).
In March 2005, the Securities and Exchange Commission (""SEC'') released SAB No. 107, ""Share-based
Payment'', which provides the views of the staÅ regarding the interaction between SFAS No. 123R and
certain SEC rules and regulations for public companies. In April 2005, the SEC adopted a rule that amends
the compliance dates of SFAS No. 123R. Under the revised compliance dates, we will be required to adopt
the provisions of SFAS No. 123R no later than the Ñrst interim period of Ñscal 2007. While management
continues to evaluate the impact of SFAS No. 123R on our consolidated Ñnancial statements, we currently
believe that the expensing of stock-based compensation will have an impact on our Consolidated Statements
of Operations similar to our pro forma disclosure under SFAS No. 123, as amended.
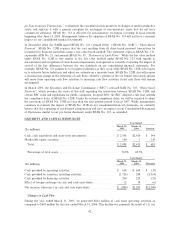
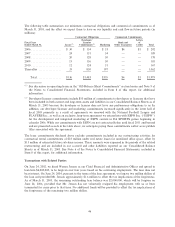
LIQUIDITY AND CAPITAL RESOURCES
Year Ended
March 31, March 31,
2005 2004 Increase
(In millions)
Cash, cash equivalents and short-term investments ÏÏÏÏÏÏÏÏÏÏÏÏÏÏÏÏÏÏÏ $ 2,958 $2,414 $ 544
Marketable equity securities ÏÏÏÏÏÏÏÏÏÏÏÏÏÏÏÏÏÏÏÏÏÏÏÏÏÏÏÏÏÏÏÏÏÏÏÏÏÏ 140 1 139
TotalÏÏÏÏÏÏÏÏÏÏÏÏÏÏÏÏÏÏÏÏÏÏÏÏÏÏÏÏÏÏÏÏÏÏÏÏÏÏÏÏÏÏÏÏÏÏÏÏÏÏÏÏÏÏÏÏ $ 3,098 $2,415 $ 683
Percentage of total assetsÏÏÏÏÏÏÏÏÏÏÏÏÏÏÏÏÏÏÏÏÏÏÏÏÏÏÏÏÏÏÏÏÏÏÏÏÏÏÏ 70.9% 69.7%
Year Ended
March 31, March 31,
2005 2004 Decrease
(In millions)
Cash provided by operating activitiesÏÏÏÏÏÏÏÏÏÏÏÏÏÏÏÏÏÏÏÏÏÏÏÏÏÏÏÏÏÏÏ $ 634 $ 669 $ (35)
Cash provided by (used in) investing activities ÏÏÏÏÏÏÏÏÏÏÏÏÏÏÏÏÏÏÏÏÏÏ (1,726) 288 (2,014)
Cash provided by Ñnancing activities ÏÏÏÏÏÏÏÏÏÏÏÏÏÏÏÏÏÏÏÏÏÏÏÏÏÏÏÏÏÏÏ 200 225 (25)
EÅect of foreign exchange on cash and cash equivalents ÏÏÏÏÏÏÏÏÏÏÏÏÏÏ 12 18 (6)
Net increase (decrease) in cash and cash equivalentsÏÏÏÏÏÏÏÏÏÏÏÏÏÏÏÏÏ $ (880) $1,200 $(2,080)
Changes in Cash Flow
During the year ended March 31, 2005, we generated $634 million of cash from operating activities as
compared to $669 million for the year ended March 31, 2004. This decline was primarily the result of (1) our
42