Electronic Arts 2005 Annual Report Download - page 83
Download and view the complete annual report
Please find page 83 of the 2005 Electronic Arts annual report below. You can navigate through the pages in the report by either clicking on the pages listed below, or by using the keyword search tool below to find specific information within the annual report.-
 1
1 -
2
-
3
-
4
-
5
-
6
-
7
-
8
-
9
-
10
-
11
-
12
-
13
-
14
-
15
-
16
-
17
-
18
-
19
-
20
-
21
-
22
-
23
-
24
-
25
-
26
-
27
-
28
-
29
-
30
-
31
-
32
-
33
-
34
-
35
-
36
-
37
-
38
-
39
-
40
-
41
-
42
-
43
-
44
-
45
-
46
-
47
-
48
-
49
-
50
-
51
-
52
-
53
-
54
-
55
-
56
-
57
-
58
-
59
-
60
-
61
-
62
-
63
-
64
-
65
-
66
-
67
-
68
-
69
-
70
-
71
-
72
-
 73
73 -
 74
74 -
 75
75 -
 76
76 -
 77
77 -
 78
78 -
 79
79 -
 80
80 -
 81
81 -
 82
82 -
 83
83 -
 84
84 -
 85
85 -
 86
86 -
 87
87 -
 88
88 -
 89
89 -
 90
90 -
 91
91 -
 92
92 -
 93
93 -
94
-
95
-
96
-
97
-
98
-
99
-
100
-
101
-
102
-
103
-
104
-
105
-
106
-
107
-
108
-
109
-
110
-
111
-
112
-
113
-
114
-
115
-
116
-
117
-
118
-
119
-
120
-
121
-
122
-
123
-
124
-
125
-
126
-
127
-
128
-
129
-
130
-
131
-
132
-
133
-
134
-
135
-
136
-
137
-
138
-
139
-
140
-
141
-
142
-
143
-
144
-
145
-
146
-
147
-
148
-
149
-
150
-
151
-
152
-
153
-
154
-
155
-
156
-
157
-
158
-
159
-
160
-
161
-
162
-
163
-
164
-
165
-
166
-
167
-
168
 |
 |

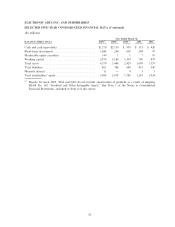
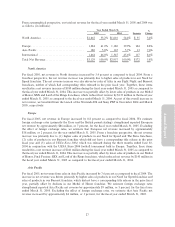
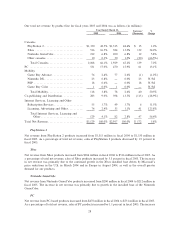
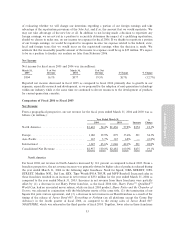
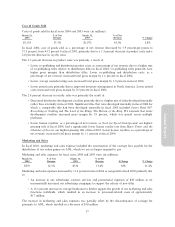
From a geographical perspective, our total net revenue for the Ñscal years ended March 31, 2005 and 2004 was
as follows (in millions):
Year Ended March 31, %
2005 2004 Increase Change
North America ÏÏÏÏÏÏÏÏÏÏÏÏÏÏÏÏÏÏÏÏÏÏÏÏÏÏÏÏÏÏ $1,665 53.2% $1,610 54.4% $ 55 3.4%
Europe ÏÏÏÏÏÏÏÏÏÏÏÏÏÏÏÏÏÏÏÏÏÏÏÏÏÏÏÏÏÏÏÏÏÏÏÏÏ 1,284 41.0% 1,180 39.9% 104 8.8%
Asia PaciÑc ÏÏÏÏÏÏÏÏÏÏÏÏÏÏÏÏÏÏÏÏÏÏÏÏÏÏÏÏÏÏÏÏÏ 180 5.8% 167 5.7% 13 7.6%
International ÏÏÏÏÏÏÏÏÏÏÏÏÏÏÏÏÏÏÏÏÏÏÏÏÏÏÏÏÏÏÏÏ 1,464 46.8% 1,347 45.6% 117 8.6%
Total Net RevenueÏÏÏÏÏÏÏÏÏÏÏÏÏÏÏÏÏÏÏÏÏÏÏÏÏÏÏ $3,129 100.0% $2,957 100.0% $172 5.8%
North America
For Ñscal 2005, net revenue in North America increased by 3.4 percent as compared to Ñscal 2004. From a
franchise perspective, the net revenue increase was primarily due to higher sales of products in our Need for
Speed franchise. The net revenue increase was also driven by sales of titles in our Fight Night and Burnout
franchises, neither of which had corresponding titles released in the prior Ñscal year. Together, these items
resulted in a net revenue increase of $180 million during the Ñscal year ended March 31, 2005 as compared to
the Ñscal year ended March 31, 2004. This increase was partially oÅset by lower sales of products in our Medal
of Honor, SSX and Lord of the Rings franchises, which reduced net revenue by $135 million in the Ñscal year
ended March 31, 2005 as compared to the Ñscal year ended March 31, 2004. As part of this overall increase in
net revenue, we beneÑted from the launch of the Nintendo DS and Sony PSP in November 2004 and March
2005, respectively.
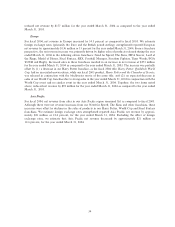
Europe
For Ñscal 2005, net revenue in Europe increased by 8.8 percent as compared to Ñscal 2004. We estimate
foreign exchange rates (primarily the Euro and the British pound sterling) strengthened reported European
net revenue by approximately $86 million, or 7 percent, for the Ñscal year ended March 31, 2005. Excluding
the eÅect of foreign exchange rates, we estimate that European net revenue increased by approximately
$18 million, or 2 percent, for the year ended March 31, 2005. From a franchise perspective, the net revenue
increase was primarily due to (1) higher sales of products in our Need for Speed and The Sims franchises,
(2) sales of products in our Burnout franchise which did not have a corresponding title release in the prior
Ñscal year and (3) sales of UEFA Euro 2004, which was released during the three months ended June 30,
Annual Report
2004 in conjunction with the UEFA Euro 2004 football tournament held in Europe. Together, these items
resulted in a net revenue increase of $241 million during the Ñscal year ended March 31, 2005 as compared to
the Ñscal year ended March 31, 2004. This increase was partially oÅset by lower sales of products in our Medal
of Honor, Final Fantasy, SSX and Lord of the Rings franchises, which reduced net revenue by $143 million in
the Ñscal year ended March 31, 2005 as compared to the Ñscal year ended March 31, 2004.
Asia PaciÑc
For Ñscal 2005, net revenue from sales in Asia PaciÑc increased by 7.6 percent as compared to Ñscal 2004. The
increase in net revenue was driven primarily by higher sales of products in our Need for Speed franchise and
sales of products in our Burnout franchise, which did not have a corresponding title release in the prior Ñscal
year, partially oÅset by declines in our Medal of Honor franchise. We estimate foreign exchange rates
strengthened reported Asia PaciÑc net revenue by approximately $9 million, or 5 percent, for the Ñscal year
ended March 31, 2005. Excluding the eÅect of foreign exchange rates, we estimate that Asia PaciÑc net
revenue increased by approximately $4 million, or 3 percent, for the Ñscal year ended March 31, 2005.
27