Electronic Arts 2005 Annual Report Download - page 127
Download and view the complete annual report
Please find page 127 of the 2005 Electronic Arts annual report below. You can navigate through the pages in the report by either clicking on the pages listed below, or by using the keyword search tool below to find specific information within the annual report.-
 1
1 -
2
-
3
-
4
-
5
-
6
-
7
-
8
-
9
-
10
-
11
-
12
-
13
-
14
-
15
-
16
-
17
-
18
-
19
-
20
-
21
-
22
-
23
-
24
-
25
-
26
-
27
-
28
-
29
-
30
-
31
-
32
-
33
-
34
-
35
-
36
-
37
-
38
-
39
-
40
-
41
-
42
-
43
-
44
-
45
-
46
-
47
-
48
-
49
-
50
-
51
-
52
-
53
-
54
-
55
-
56
-
57
-
58
-
59
-
60
-
61
-
62
-
63
-
64
-
65
-
66
-
67
-
68
-
69
-
70
-
71
-
72
-
73
-
74
-
75
-
76
-
77
-
78
-
79
-
80
-
81
-
82
-
83
-
84
-
85
-
86
-
87
-
88
-
89
-
90
-
91
-
92
-
93
-
94
-
95
-
96
-
97
-
98
-
99
-
100
-
101
-
102
-
103
-
104
-
105
-
106
-
107
-
108
-
109
-
110
-
111
-
112
-
113
-
114
-
115
-
116
-
 117
117 -
 118
118 -
 119
119 -
 120
120 -
 121
121 -
 122
122 -
 123
123 -
 124
124 -
 125
125 -
 126
126 -
 127
127 -
 128
128 -
 129
129 -
 130
130 -
 131
131 -
 132
132 -
 133
133 -
 134
134 -
 135
135 -
 136
136 -
 137
137 -
138
-
139
-
140
-
141
-
142
-
143
-
144
-
145
-
146
-
147
-
148
-
149
-
150
-
151
-
152
-
153
-
154
-
155
-
156
-
157
-
158
-
159
-
160
-
161
-
162
-
163
-
164
-
165
-
166
-
167
-
168
 |
 |

Chapter 4, ""Inventory Pricing'', to clarify the accounting for abnormal amounts of idle facility expense, freight,
handling costs, and wasted material (spoilage) and requires that those items be recognized as current-period
charges. SFAS No. 151 also requires that allocation of Ñxed production overheads to the costs of conversion
be based on the normal capacity of the production facilities. SFAS No. 151 is eÅective for inventory costs
incurred during Ñscal years beginning after June 15, 2005. Management believes the adoption of
SFAS No. 151 will not have a material impact on our consolidated Ñnancial statements.
In December 2004, the FASB issued SFAS No. 153, ""Exchange of Non-monetary Assets Ì an amendment
of APB Opinion No. 29''. SFAS No. 153 amends APB No. 29, ""Accounting for Non-monetary Transactions'',
to eliminate the exception for non-monetary exchanges of similar productive assets and replaces it with a
general exception for exchanges of non-monetary assets that do not have commercial substance.
SFAS No. 153 is eÅective for non-monetary exchanges occurring in Ñscal periods beginning after June 15,
2005. Management believes the adoption of SFAS No. 153 will not have a material impact on our
consolidated Ñnancial statements.
(2) FINANCIAL INSTRUMENTS
(a) Fair Value of Financial Instruments
Cash, cash equivalents, receivables, accounts payable and accrued and other liabilities are valued at their
carrying amounts as they approximate their fair value due to the short maturity of these Ñnancial instruments.
All of our short-term investments and marketable equity securities were classiÑed as available-for-sale as of
March 31, 2005 and 2004. The fair value of these investments is determined using quoted market prices for
the securities or similar Ñnancial instruments.
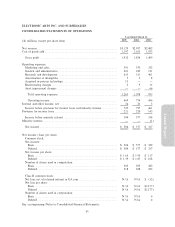
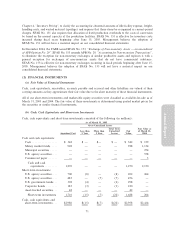
(b) Cash, Cash Equivalents and Short-term Investments
Cash, cash equivalents and short-term investments consisted of the following (in millions):
As of March 31, 2005
Gross Unrealized Losses
Total Gross Fair Value as
Less than More than Unrealized Fair of March 31,
Amortized Cost 1 Year 1 Year Losses Value 2004
Cash and cash equivalents:
Cash ÏÏÏÏÏÏÏÏÏÏÏÏÏÏÏÏÏÏ $ 342 $ Ì $Ì $ Ì $ 342 $ 159
Annual Report
Money market fundsÏÏÏÏÏ 928 Ì Ì Ì 928 1,134
Municipal securities ÏÏÏÏÏ Ì Ì Ì Ì Ì 274
U.S. agency securitiesÏÏÏÏ Ì Ì Ì Ì Ì 578
Commercial paperÏÏÏÏÏÏÏ Ì Ì Ì Ì Ì 5
Cash and cash
equivalents ÏÏÏÏÏÏÏÏÏ 1,270 Ì Ì Ì 1,270 2,150
Short-term investments:
U.S. agency securitiesÏÏÏÏ 700 (8) Ì (8) 692 264
U.S. agency securitiesÏÏÏÏ 483 Ì (7) (7) 476 Ì
U.S. government bonds ÏÏ 302 (4) Ì (4) 298 Ì
Corporate bonds ÏÏÏÏÏÏÏÏ 183 (3) Ì (3) 180 Ì
Asset-backed securitiesÏÏÏ 42 Ì Ì Ì 42 Ì
Short-term investments 1,710 (15) (7) (22) 1,688 264
Cash, cash equivalents and
short-term investments ÏÏÏ $2,980 $(15) $(7) $(22) $2,958 $2,414
71