Electronic Arts 2007 Annual Report Download - page 101
Download and view the complete annual report
Please find page 101 of the 2007 Electronic Arts annual report below. You can navigate through the pages in the report by either clicking on the pages listed below, or by using the keyword search tool below to find specific information within the annual report.-
 1
1 -
2
-
3
-
4
-
5
-
6
-
7
-
8
-
9
-
10
-
11
-
12
-
13
-
14
-
15
-
16
-
17
-
18
-
19
-
20
-
21
-
22
-
23
-
24
-
25
-
26
-
27
-
28
-
29
-
30
-
31
-
32
-
33
-
34
-
35
-
36
-
37
-
38
-
39
-
40
-
41
-
42
-
43
-
44
-
45
-
46
-
47
-
48
-
49
-
50
-
51
-
52
-
53
-
54
-
55
-
56
-
57
-
58
-
59
-
60
-
61
-
62
-
63
-
64
-
65
-
66
-
67
-
68
-
69
-
70
-
71
-
72
-
73
-
74
-
75
-
76
-
77
-
78
-
79
-
80
-
81
-
82
-
83
-
84
-
85
-
86
-
87
-
88
-
89
-
90
-
 91
91 -
 92
92 -
 93
93 -
 94
94 -
 95
95 -
 96
96 -
 97
97 -
 98
98 -
 99
99 -
 100
100 -
 101
101 -
 102
102 -
 103
103 -
 104
104 -
 105
105 -
 106
106 -
 107
107 -
 108
108 -
 109
109 -
 110
110 -
 111
111 -
112
-
113
-
114
-
115
-
116
-
117
-
118
-
119
-
120
-
121
-
122
-
123
-
124
-
125
-
126
-
127
-
128
-
129
-
130
-
131
-
132
-
133
-
134
-
135
-
136
-
137
-
138
-
139
-
140
-
141
-
142
-
143
-
144
-
145
-
146
-
147
-
148
-
149
-
150
-
151
-
152
-
153
-
154
-
155
-
156
-
157
-
158
-
159
-
160
-
161
-
162
-
163
-
164
-
165
-
166
-
167
-
168
-
169
-
170
-
171
-
172
-
173
-
174
-
175
-
176
-
177
-
178
-
179
-
180
-
181
-
182
-
183
-
184
-
185
-
186
-
187
-
188
-
189
-
190
-
191
-
192
-
193
 |
 |

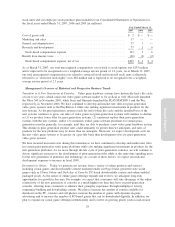
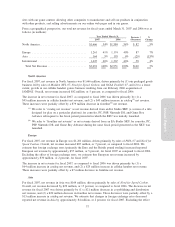
BALANCE SHEET DATA 2007
(a)
2006 2005 2004 2003
Year Ended March 31,
Cash and cash equivalents .......................... $1,371 $1,242 $1,270 $2,150 $ 950
Short-term investments ............................ 1,264 1,030 1,688 264 638
Marketable equity securities ........................ 341 160 140 1 1
Working capital ................................. 2,571 2,143 2,899 2,185 1,334
Total assets..................................... 5,146 4,386 4,370 3,464 2,429
Long-term liabilities .............................. 88 97 54 42 54
Total liabilities .................................. 1,114 966 861 786 640
Minority interest ................................. — 12 11 — 4
Total stockholders’ equity .......................... 4,032 3,408 3,498 2,678 1,785
(a)
Beginning in fiscal 2007, we adopted Statement of Financial Accounting Standard No. 123 (revised 2004)
(“SFAS No. 123(R)”), “Share-Based Payment”. Accordingly, in fiscal 2007, we recognized stock-based
compensation expense of $133 million, pre-tax, and $107 million, net of tax. See Note 12 of the Notes to
Consolidated Financial Statements for a detailed functional line-item breakdown of our stock-based com-
pensation expense.
Annual Report
27
ELECTRONIC ARTS INC. AND SUBSIDIARIES
SELECTED FIVE-YEAR CONSOLIDATED FINANCIAL DATA (Continued)
(In millions)