Electronic Arts 2007 Annual Report Download - page 171
Download and view the complete annual report
Please find page 171 of the 2007 Electronic Arts annual report below. You can navigate through the pages in the report by either clicking on the pages listed below, or by using the keyword search tool below to find specific information within the annual report.-
 1
1 -
2
-
3
-
4
-
5
-
6
-
7
-
8
-
9
-
10
-
11
-
12
-
13
-
14
-
15
-
16
-
17
-
18
-
19
-
20
-
21
-
22
-
23
-
24
-
25
-
26
-
27
-
28
-
29
-
30
-
31
-
32
-
33
-
34
-
35
-
36
-
37
-
38
-
39
-
40
-
41
-
42
-
43
-
44
-
45
-
46
-
47
-
48
-
49
-
50
-
51
-
52
-
53
-
54
-
55
-
56
-
57
-
58
-
59
-
60
-
61
-
62
-
63
-
64
-
65
-
66
-
67
-
68
-
69
-
70
-
71
-
72
-
73
-
74
-
75
-
76
-
77
-
78
-
79
-
80
-
81
-
82
-
83
-
84
-
85
-
86
-
87
-
88
-
89
-
90
-
91
-
92
-
93
-
94
-
95
-
96
-
97
-
98
-
99
-
100
-
101
-
102
-
103
-
104
-
105
-
106
-
107
-
108
-
109
-
110
-
111
-
112
-
113
-
114
-
115
-
116
-
117
-
118
-
119
-
120
-
121
-
122
-
123
-
124
-
125
-
126
-
127
-
128
-
129
-
130
-
131
-
132
-
133
-
134
-
135
-
136
-
137
-
138
-
139
-
140
-
141
-
142
-
143
-
144
-
145
-
146
-
147
-
148
-
149
-
150
-
151
-
152
-
153
-
154
-
155
-
156
-
157
-
158
-
159
-
160
-
 161
161 -
 162
162 -
 163
163 -
 164
164 -
 165
165 -
 166
166 -
 167
167 -
 168
168 -
 169
169 -
 170
170 -
 171
171 -
 172
172 -
 173
173 -
 174
174 -
 175
175 -
 176
176 -
 177
177 -
 178
178 -
 179
179 -
 180
180 -
 181
181 -
182
-
183
-
184
-
185
-
186
-
187
-
188
-
189
-
190
-
191
-
192
-
193
 |
 |

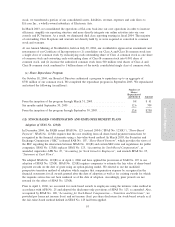
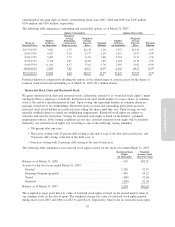
(determined at the grant date) of shares vested during fiscal years 2007, 2006 and 2005 was $105 million,
$150 million and $130 million, respectively.
The following table summarizes outstanding and exercisable options as of March 31, 2007:
Range of
Exercise Prices
Number
of Shares
(in thousands)
Weighted-
Average
Remaining
Contractual
Term (in years)
Weighted-
Average
Exercise
Price
Potential
Dilution
Number
of Shares
(in thousands)
Weighted-
Average
Exercise
Price
Potential
Dilution
Options Outstanding Options Exercisable
$0.53-$19.99 3,681 1.72 $12.42 1.2% 3,675 $12.44 1.2%
20.00-29.99 6,427 4.26 25.37 2.1% 6,422 25.37 2.0%
30.00-39.99 5,487 5.35 31.83 1.8% 5,293 31.73 1.7%
40.00-49.99 5,768 6.87 46.88 1.8% 4,024 47.19 1.3%
50.00-59.99 11,641 8.37 53.62 3.7% 2,903 54.02 0.9%
60.00-65.93 2,860 7.82 64.17 0.9% 1,162 64.37 0.4%
$0.53-$65.93 35,864 6.20 $40.75 11.5% 23,479 $33.99 7.5%
Potential dilution is computed by dividing the options in the related range of exercise prices by the shares of
common stock issued and outstanding as of March 31, 2007 (311 million shares).
Restricted Stock Units and Restricted Stock
We grant restricted stock units and restricted stock (collectively referred to as “restricted stock rights”) under
our Equity Plan to employees worldwide. Restricted stock units entitle holders to receive shares of common
stock at the end of a specified period of time. Upon vesting, the equivalent number of common shares are
typically issued net of tax withholdings. Restricted stock is issued and outstanding upon grant; however,
restricted stock award holders are restricted from selling the shares until they vest. Upon vesting, we will
typically withhold shares to satisfy tax withholding requirements. Restricted stock rights are subject to
forfeiture and transfer restrictions. Vesting for restricted stock rights is based on the holders’ continued
employment with us. If the vesting conditions are not met, unvested restricted stock rights will be forfeited.
Generally, our restricted stock rights vest according to one of the following vesting schedules:
• 100 percent after one year;
• Three-year vesting with 25 percent cliff vesting at the end of each of the first and second years, and
50 percent cliff vesting at the end of the third year; or
• Four-year vesting with 25 percent cliff vesting at the end of each year.
The following table summarizes our restricted stock rights activity for the fiscal year ended March 31, 2007:
Restricted Stock
Rights
(In thousands)
Weighted-
Average Grant
Date Fair Value
Balance as of March 31, 2006 ................................... 655 $52.21
Activity for the fiscal year ended March 31, 2007:
Granted .................................................. 1,362 52.31
Exchange Program (granted) ................................... 445 54.22
Vested ................................................... (189) 52.60
Forfeited ................................................. (139) 52.74
Balance as of March 31, 2007 ................................... 2,134 $52.62
The weighted-average grant date fair value of restricted stock rights is based on the quoted market value of
our common stock on the date of grant. The weighted-average fair value of restricted stock rights granted
during fiscal years 2007 and 2006 was $52.31 and $52.21, respectively. There were no restricted stock rights
Annual Report
97