Electronic Arts 2007 Annual Report Download - page 114
Download and view the complete annual report
Please find page 114 of the 2007 Electronic Arts annual report below. You can navigate through the pages in the report by either clicking on the pages listed below, or by using the keyword search tool below to find specific information within the annual report.-
 1
1 -
2
-
3
-
4
-
5
-
6
-
7
-
8
-
9
-
10
-
11
-
12
-
13
-
14
-
15
-
16
-
17
-
18
-
19
-
20
-
21
-
22
-
23
-
24
-
25
-
26
-
27
-
28
-
29
-
30
-
31
-
32
-
33
-
34
-
35
-
36
-
37
-
38
-
39
-
40
-
41
-
42
-
43
-
44
-
45
-
46
-
47
-
48
-
49
-
50
-
51
-
52
-
53
-
54
-
55
-
56
-
57
-
58
-
59
-
60
-
61
-
62
-
63
-
64
-
65
-
66
-
67
-
68
-
69
-
70
-
71
-
72
-
73
-
74
-
75
-
76
-
77
-
78
-
79
-
80
-
81
-
82
-
83
-
84
-
85
-
86
-
87
-
88
-
89
-
90
-
91
-
92
-
93
-
94
-
95
-
96
-
97
-
98
-
99
-
100
-
101
-
102
-
103
-
 104
104 -
 105
105 -
 106
106 -
 107
107 -
 108
108 -
 109
109 -
 110
110 -
 111
111 -
 112
112 -
 113
113 -
 114
114 -
 115
115 -
 116
116 -
 117
117 -
 118
118 -
 119
119 -
 120
120 -
 121
121 -
 122
122 -
 123
123 -
 124
124 -
125
-
126
-
127
-
128
-
129
-
130
-
131
-
132
-
133
-
134
-
135
-
136
-
137
-
138
-
139
-
140
-
141
-
142
-
143
-
144
-
145
-
146
-
147
-
148
-
149
-
150
-
151
-
152
-
153
-
154
-
155
-
156
-
157
-
158
-
159
-
160
-
161
-
162
-
163
-
164
-
165
-
166
-
167
-
168
-
169
-
170
-
171
-
172
-
173
-
174
-
175
-
176
-
177
-
178
-
179
-
180
-
181
-
182
-
183
-
184
-
185
-
186
-
187
-
188
-
189
-
190
-
191
-
192
-
193
 |
 |

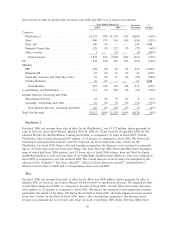
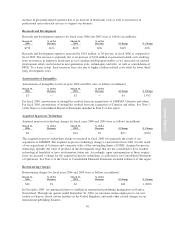
Co-Publishing and Distribution
Net revenue from co-publishing and distribution products, which consists of packaged goods games we co-
develop and co-publish with as well as distribute on behalf of other companies and revenue generated from
our Switzerland distribution business, decreased from $213 million in fiscal 2006 to $175 million in fiscal
2007. The decrease was primarily due to a decline in sales from two titles which were released in fiscal 2006
but had no corresponding releases in fiscal 2007: (1) Half-Life 2, sales of which decreased by $19 million and
(2) Black & White 2
TM
, sales of which decreased by $15 million.
We expect sales of titles for co-publishing products to increase in fiscal 2008.
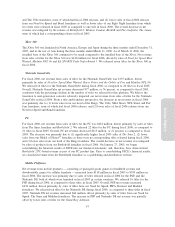
Cost of Goods Sold
Cost of goods sold for our packaged-goods business consists of (1) product costs, (2) certain royalty expenses
for celebrities, professional sports and other organizations and independent software developers, (3) manufac-
turing royalties, net of volume discounts and other vendor reimbursements, (4) expenses for defective products,
(5) write-offs of post-launch prepaid royalty costs, (6) amortization of certain intangible assets, and (7) opera-
tional expenses. We generally recognize volume discounts when they are earned from the manufacturer
(typically in connection with the achievement of unit-based milestones), whereas other vendor reimbursements
are generally recognized as the related revenue is recognized. Cost of goods sold for our online products
consists primarily of data center and bandwidth costs associated with hosting our web sites, credit card fees
and royalties for use of third-party properties. Cost of goods sold for our web site advertising business
primarily consists of ad-serving costs.
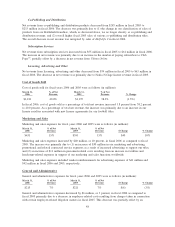
Cost of goods sold for fiscal years 2007 and 2006 were as follows (in millions):
March 31,
2007
%ofNet
Revenue
March 31,
2006
%ofNet
Revenue % Change
Change as a
%ofNet
Revenue
$1,212 39.2% $1,181 40.0% 2.6% (0.8%)
In fiscal 2007, cost of goods sold decreased by 0.8 percentage points as a percentage of total net revenue as
compared to fiscal 2006. This decrease was primarily due to lower average product costs as a percentage of
total net revenue primarily driven by (1) fewer returns and lower pricing actions taken, or expected to be
taken, in fiscal 2007 as compared to fiscal 2006 and (2) improved inventory management. As a result, we
estimate average product costs as a percentage of total net revenue decreased by approximately 2 percent in
fiscal 2007 as compared to fiscal 2006.
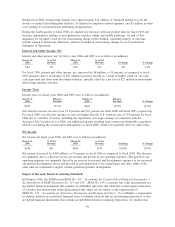
As a percentage of total net revenue, the decrease in average product costs was partially offset by an estimated
1 percent increase in license royalties during fiscal 2007 as compared to fiscal 2006 primarily due to (1) license
agreements associated with our EA SPORTS titles and (2) from our acquisition of JAMDAT. This was partially
offset by lower license royalties from movie-based titles in fiscal 2007.
Although there can be no assurance, and our actual results could differ materially, in the short-term we expect
our gross margin to decline as a result of (1) increased deferred net revenue related to certain online-enabled
packaged goods (we will expense the cost of goods sold related to these transactions when delivered), (2) a
higher mix of co-publishing and distribution net revenue that has a lower gross margin, and (3) higher license
royalty rates.
Marketing and Sales
Marketing and sales expenses consist of personnel-related costs and advertising, marketing and promotional
expenses, net of qualified advertising cost reimbursements from third parties.
Marketing and sales expenses for fiscal years 2007 and 2006 were as follows (in millions):
March 31,
2007
%ofNet
Revenue
March 31,
2006
%ofNet
Revenue $ Change % Change
$466 15% $431 15% $35 8%
40