Electronic Arts 2007 Annual Report Download - page 148
Download and view the complete annual report
Please find page 148 of the 2007 Electronic Arts annual report below. You can navigate through the pages in the report by either clicking on the pages listed below, or by using the keyword search tool below to find specific information within the annual report.-
 1
1 -
2
-
3
-
4
-
5
-
6
-
7
-
8
-
9
-
10
-
11
-
12
-
13
-
14
-
15
-
16
-
17
-
18
-
19
-
20
-
21
-
22
-
23
-
24
-
25
-
26
-
27
-
28
-
29
-
30
-
31
-
32
-
33
-
34
-
35
-
36
-
37
-
38
-
39
-
40
-
41
-
42
-
43
-
44
-
45
-
46
-
47
-
48
-
49
-
50
-
51
-
52
-
53
-
54
-
55
-
56
-
57
-
58
-
59
-
60
-
61
-
62
-
63
-
64
-
65
-
66
-
67
-
68
-
69
-
70
-
71
-
72
-
73
-
74
-
75
-
76
-
77
-
78
-
79
-
80
-
81
-
82
-
83
-
84
-
85
-
86
-
87
-
88
-
89
-
90
-
91
-
92
-
93
-
94
-
95
-
96
-
97
-
98
-
99
-
100
-
101
-
102
-
103
-
104
-
105
-
106
-
107
-
108
-
109
-
110
-
111
-
112
-
113
-
114
-
115
-
116
-
117
-
118
-
119
-
120
-
121
-
122
-
123
-
124
-
125
-
126
-
127
-
128
-
129
-
130
-
131
-
132
-
133
-
134
-
135
-
136
-
137
-
 138
138 -
 139
139 -
 140
140 -
 141
141 -
 142
142 -
 143
143 -
 144
144 -
 145
145 -
 146
146 -
 147
147 -
 148
148 -
 149
149 -
 150
150 -
 151
151 -
 152
152 -
 153
153 -
 154
154 -
 155
155 -
 156
156 -
 157
157 -
 158
158 -
159
-
160
-
161
-
162
-
163
-
164
-
165
-
166
-
167
-
168
-
169
-
170
-
171
-
172
-
173
-
174
-
175
-
176
-
177
-
178
-
179
-
180
-
181
-
182
-
183
-
184
-
185
-
186
-
187
-
188
-
189
-
190
-
191
-
192
-
193
 |
 |

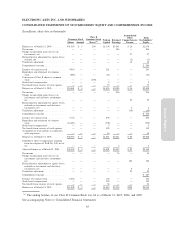
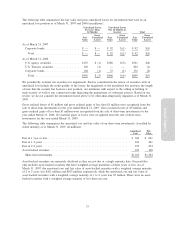
(b) Cash, Cash Equivalents and Short-term Investments
Cash, cash equivalents and short-term investments consisted of the following as of March 31, 2007 and 2006
(in millions):
Cost or
Amortized
Cost
Gross
Unrealized
Gains
Gross
Unrealized
Losses
Fair
Value
As of March 31, 2007
Cash and cash equivalents:
Cash . ......................................... $ 194 $— $— $ 194
Money market funds .............................. 989 — — 989
Commercial paper ................................ 188 — — 188
Cash and cash equivalents......................... 1,371 — — 1,371
Short-term investments:
Commercial paper ................................ 574 — — 574
U.S. agency securities ............................. 263 1 — 264
Corporate bonds.................................. 227 — (1) 226
Asset-backed securities............................. 107 1 — 108
U.S. Treasury securities ............................ 92 — — 92
Short-term investments ........................... 1,263 2 (1) 1,264
Cash, cash equivalents and short-term investments .......... $2,634 $ 2 $ (1) $2,635
Cost or
Amortized
Cost
Gross
Unrealized
Gains
Gross
Unrealized
Losses
Fair
Value
As of March 31, 2006
Cash and cash equivalents:
Cash . ......................................... $ 260 $— $— $ 260
Money market funds .............................. 819 — — 819
Commercial paper ................................ 145 — — 145
U.S. agency securities ............................. 14 — — 14
Asset-backed securities............................. 4 — — 4
Cash and cash equivalents......................... 1,242 — — 1,242
Short-term investments:
U.S. agency securities ............................. 579 — (4) 575
U.S. Treasury securities ............................ 213 — (1) 212
Corporate bonds.................................. 180 — (2) 178
Asset-backed securities............................. 40 — — 40
Commercial paper ................................ 25 — — 25
Short-term investments ........................... 1,037 — (7) 1,030
Cash, cash equivalents and short-term investments .......... $2,279 $ — $ (7) $2,272
74