Electronic Arts 2007 Annual Report Download - page 79
Download and view the complete annual report
Please find page 79 of the 2007 Electronic Arts annual report below. You can navigate through the pages in the report by either clicking on the pages listed below, or by using the keyword search tool below to find specific information within the annual report.-
 1
1 -
2
-
3
-
4
-
5
-
6
-
7
-
8
-
9
-
10
-
11
-
12
-
13
-
14
-
15
-
16
-
17
-
18
-
19
-
20
-
21
-
22
-
23
-
24
-
25
-
26
-
27
-
28
-
29
-
30
-
31
-
32
-
33
-
34
-
35
-
36
-
37
-
38
-
39
-
40
-
41
-
42
-
43
-
44
-
45
-
46
-
47
-
48
-
49
-
50
-
51
-
52
-
53
-
54
-
55
-
56
-
57
-
58
-
59
-
60
-
61
-
62
-
63
-
64
-
65
-
66
-
67
-
68
-
 69
69 -
 70
70 -
 71
71 -
 72
72 -
 73
73 -
 74
74 -
 75
75 -
 76
76 -
 77
77 -
 78
78 -
 79
79 -
 80
80 -
 81
81 -
 82
82 -
 83
83 -
 84
84 -
 85
85 -
 86
86 -
 87
87 -
 88
88 -
 89
89 -
90
-
91
-
92
-
93
-
94
-
95
-
96
-
97
-
98
-
99
-
100
-
101
-
102
-
103
-
104
-
105
-
106
-
107
-
108
-
109
-
110
-
111
-
112
-
113
-
114
-
115
-
116
-
117
-
118
-
119
-
120
-
121
-
122
-
123
-
124
-
125
-
126
-
127
-
128
-
129
-
130
-
131
-
132
-
133
-
134
-
135
-
136
-
137
-
138
-
139
-
140
-
141
-
142
-
143
-
144
-
145
-
146
-
147
-
148
-
149
-
150
-
151
-
152
-
153
-
154
-
155
-
156
-
157
-
158
-
159
-
160
-
161
-
162
-
163
-
164
-
165
-
166
-
167
-
168
-
169
-
170
-
171
-
172
-
173
-
174
-
175
-
176
-
177
-
178
-
179
-
180
-
181
-
182
-
183
-
184
-
185
-
186
-
187
-
188
-
189
-
190
-
191
-
192
-
193
 |
 |

In addition, our EA Partners group operates under a variety of deal types and structures with the intent of
making available our publishing marketing and distribution services to game developers who may not have the
scale of our resources.
In fiscal 2007, we had two titles, Need for Speed Carbon and Madden NFL 07, published on 10 different
platforms, each of which represented approximately 11 percent of our total net revenue. In fiscal 2006, we had
one title, Need for Speed Most Wanted, published on eight different platforms, which represented approx-
imately 10 percent of our total net revenue. In fiscal 2005, we had one title, Need for Speed Underground 2,
published on five different platforms, which represented approximately 11 percent of our total net revenue.
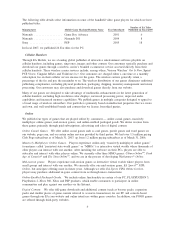
Packaged Goods
The console, PC and handheld games that we publish are made available to consumers as packaged goods
(usually Blu-ray Disc, CD, DVD, cartridge or Universal Media Disc format) that are typically sold in retail
stores and through online stores (including our own online store). In North America and Europe, our largest
markets, we sell these packaged goods products primarily to retailers, including mass market retailers (such as
Wal-Mart), electronics specialty stores (such as Best Buy) or game software specialty stores (such as
GameStop). Many of our PC products can also be purchased over the Internet through digital download.
We generated approximately 95 percent of our North American packaged goods net revenue from direct sales
to retailers, with the remaining net revenue being generated through a limited number of specialized and
regional distributors and rack jobbers in markets where we believe direct sales would not be economical.
Outside of North America, we derive packaged goods revenue primarily from direct sales to retailers. In a few
of our smaller markets, we sell our packaged goods products through distributors with whom we have written
agreements or informal arrangements, depending on the business customs of the territories. We also distribute
products of other companies through our rack jobbing business in Switzerland. We had direct sales to Wal-
Mart Stores, Inc. which represented approximately 13 percent of total net revenue in both fiscal 2007 and
2006, and approximately 14 percent of total net revenue in fiscal 2005. We also had direct sales to GameStop
Corp. which represented approximately 12 percent of total net revenue in fiscal 2007.
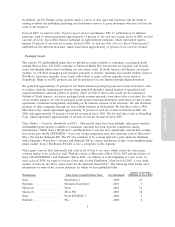
Video Games — Consoles, Handhelds and PCs. Historically, there have been multiple video game consoles
and handheld game players available to consumers, and there has been vigorous competition among
manufacturers. While Sony’s PlayStation»and PlayStation 2 consoles have significantly outsold their compet-
itors in the past, the PLAYSTATION 3 faces very strong competition from new platforms such as Microsoft’s
Xbox 360 and the Nintendo Wii. The PC also continues to be a strong interactive game platform. Similarly,
while Nintendo’s Game Boy»Advance and Nintendo DS are current and historic leaders in the handheld game
player market, Sony’s PlayStation Portable is also a competitor in this segment.
Video game consoles have historically had a life cycle of four to six years, which causes the video game
software market to be cyclical as well. With the release of Microsoft’s Xbox 360 in 2005 and the releases of
Sony’s PLAYSTATION 3 and Nintendo’s Wii in 2006, our industry is at the beginning of a new cycle. As
such, in fiscal 2008, we expect to release fewer titles for the PlayStation 2 than in fiscal 2007, a very small
number of titles for the Xbox, and no titles for the Nintendo GameCube
TM
. The following table details select
information on some of the console platforms for which we have published titles:
Manufacturer Video Game Console/Platform Name Year Introduced
Number of EA Titles
Published in Fiscal 2007
Sony ..................... PlayStation 2 2000 22
Nintendo .................. Nintendo GameCube 2001 5
Microsoft .................. Xbox 2001 11
Microsoft .................. Xbox 360 2005 18
Sony ..................... PLAYSTATION 3 2006 7
Nintendo .................. Wii 2006 6
Annual Report
5