Electronic Arts 2007 Annual Report Download - page 179
Download and view the complete annual report
Please find page 179 of the 2007 Electronic Arts annual report below. You can navigate through the pages in the report by either clicking on the pages listed below, or by using the keyword search tool below to find specific information within the annual report.-
 1
1 -
2
-
3
-
4
-
5
-
6
-
7
-
8
-
9
-
10
-
11
-
12
-
13
-
14
-
15
-
16
-
17
-
18
-
19
-
20
-
21
-
22
-
23
-
24
-
25
-
26
-
27
-
28
-
29
-
30
-
31
-
32
-
33
-
34
-
35
-
36
-
37
-
38
-
39
-
40
-
41
-
42
-
43
-
44
-
45
-
46
-
47
-
48
-
49
-
50
-
51
-
52
-
53
-
54
-
55
-
56
-
57
-
58
-
59
-
60
-
61
-
62
-
63
-
64
-
65
-
66
-
67
-
68
-
69
-
70
-
71
-
72
-
73
-
74
-
75
-
76
-
77
-
78
-
79
-
80
-
81
-
82
-
83
-
84
-
85
-
86
-
87
-
88
-
89
-
90
-
91
-
92
-
93
-
94
-
95
-
96
-
97
-
98
-
99
-
100
-
101
-
102
-
103
-
104
-
105
-
106
-
107
-
108
-
109
-
110
-
111
-
112
-
113
-
114
-
115
-
116
-
117
-
118
-
119
-
120
-
121
-
122
-
123
-
124
-
125
-
126
-
127
-
128
-
129
-
130
-
131
-
132
-
133
-
134
-
135
-
136
-
137
-
138
-
139
-
140
-
141
-
142
-
143
-
144
-
145
-
146
-
147
-
148
-
149
-
150
-
151
-
152
-
153
-
154
-
155
-
156
-
157
-
158
-
159
-
160
-
161
-
162
-
163
-
164
-
165
-
166
-
167
-
168
-
 169
169 -
 170
170 -
 171
171 -
 172
172 -
 173
173 -
 174
174 -
 175
175 -
 176
176 -
 177
177 -
 178
178 -
 179
179 -
 180
180 -
 181
181 -
 182
182 -
 183
183 -
 184
184 -
 185
185 -
 186
186 -
 187
187 -
 188
188 -
 189
189 -
190
-
191
-
192
-
193
 |
 |

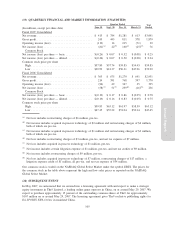
(19) QUARTERLY FINANCIAL AND MARKET INFORMATION (UNAUDITED)
(In millions, except per share data) June 30 Sept. 30 Dec. 31 March 31
Year
Ended
Quarter Ended
Fiscal 2007 Consolidated
Net revenue ................................... $ 413 $ 784 $1,281 $ 613 $3,091
Gross profit ................................... 245 445 811 378 1,879
Operating income (loss) .......................... (119) 14 215 (71) 39
Net income (loss) ............................... (81)
(a)
22
(b)
160
(c)
(25)
(d)
76
Common Stock
Net income (loss) per share — basic ................. $(0.26) $ 0.07 $ 0.52 $ (0.08) $ 0.25
Net income (loss) per share — diluted ................ $(0.26) $ 0.07 $ 0.50 $ (0.08) $ 0.24
Common stock price per share
High....................................... $57.80 $57.74 $59.85 $54.43 $59.85
Low....................................... $39.99 $41.37 $50.21 $47.96 $39.99
Fiscal 2006 Consolidated
Net revenue ................................... $ 365 $ 675 $1,270 $ 641 $2,951
Gross profit ................................... 214 391 768 397 1,770
Operating income (loss) .......................... (96) 49 347 25 325
Net income (loss) ............................... (58)
(e)
51
(f)
259
(g)
(16)
(h)
236
Common Stock
Net income (loss) per share — basic ................. $(0.19) $ 0.17 $ 0.86 $ (0.05) $ 0.78
Net income (loss) per share — diluted ................ $(0.19) $ 0.16 $ 0.83 $ (0.05) $ 0.75
Common stock price per share
High....................................... $59.83 $63.12 $61.97 $58.59 $63.12
Low....................................... $47.45 $55.22 $51.04 $50.14 $47.45
(a)
Net loss includes restructuring charges of $6 million, pre-tax.
(b)
Net income includes acquired in-process technology of $2 million and restructuring charges of $4 million,
both of which are pre-tax.
(c)
Net income includes acquired in-process technology of $1 million and restructuring charges of $2 million,
both of which are pre-tax.
(d)
Net loss includes restructuring charges of $3 million, pre-tax, and net tax expense of $7 million.
(e)
Net loss includes acquired in-process technology of $1 million, pre-tax.
(f)
Net income includes certain litigation expense of $1 million, pre-tax, and net tax credits of $9 million.
(g)
Net income includes restructuring charges of $9 million, pre-tax.
(h)
Net loss includes acquired in-process technology of $7 million, restructuring charges of $17 million, a
litigation expense credit of $1 million, all pre-tax, and net tax expense of $34 million.
Our common stock is traded on the NASDAQ Global Select Market under the symbol ERTS. The prices for
the common stock in the table above represent the high and low sales prices as reported on the NASDAQ
Global Select Market.
(20) SUBSEQUENT EVENT
In May 2007, we announced that we entered into a licensing agreement with and expect to make a strategic
equity investment in The9 Limited, a leading online game operator in China, on or around May 29, 2007. We
expect to purchase approximately 15 percent of the outstanding common shares of The9 for approximately
$167 million on or around May 29, 2007. The licensing agreement gives The9 exclusive publishing rights for
EA SPORTS FIFA Online in mainland China.
Annual Report
105