Electronic Arts 2007 Annual Report Download - page 178
Download and view the complete annual report
Please find page 178 of the 2007 Electronic Arts annual report below. You can navigate through the pages in the report by either clicking on the pages listed below, or by using the keyword search tool below to find specific information within the annual report.-
 1
1 -
2
-
3
-
4
-
5
-
6
-
7
-
8
-
9
-
10
-
11
-
12
-
13
-
14
-
15
-
16
-
17
-
18
-
19
-
20
-
21
-
22
-
23
-
24
-
25
-
26
-
27
-
28
-
29
-
30
-
31
-
32
-
33
-
34
-
35
-
36
-
37
-
38
-
39
-
40
-
41
-
42
-
43
-
44
-
45
-
46
-
47
-
48
-
49
-
50
-
51
-
52
-
53
-
54
-
55
-
56
-
57
-
58
-
59
-
60
-
61
-
62
-
63
-
64
-
65
-
66
-
67
-
68
-
69
-
70
-
71
-
72
-
73
-
74
-
75
-
76
-
77
-
78
-
79
-
80
-
81
-
82
-
83
-
84
-
85
-
86
-
87
-
88
-
89
-
90
-
91
-
92
-
93
-
94
-
95
-
96
-
97
-
98
-
99
-
100
-
101
-
102
-
103
-
104
-
105
-
106
-
107
-
108
-
109
-
110
-
111
-
112
-
113
-
114
-
115
-
116
-
117
-
118
-
119
-
120
-
121
-
122
-
123
-
124
-
125
-
126
-
127
-
128
-
129
-
130
-
131
-
132
-
133
-
134
-
135
-
136
-
137
-
138
-
139
-
140
-
141
-
142
-
143
-
144
-
145
-
146
-
147
-
148
-
149
-
150
-
151
-
152
-
153
-
154
-
155
-
156
-
157
-
158
-
159
-
160
-
161
-
162
-
163
-
164
-
165
-
166
-
167
-
 168
168 -
 169
169 -
 170
170 -
 171
171 -
 172
172 -
 173
173 -
 174
174 -
 175
175 -
 176
176 -
 177
177 -
 178
178 -
 179
179 -
 180
180 -
 181
181 -
 182
182 -
 183
183 -
 184
184 -
 185
185 -
 186
186 -
 187
187 -
 188
188 -
189
-
190
-
191
-
192
-
193
 |
 |

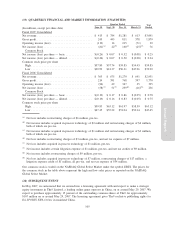
Information about our total net revenue by platform for the fiscal years ended March 31, 2007, 2006 and 2005
is presented below (in millions):
2007 2006 2005
Year Ended March 31,
Consoles
PlayStation 2 ................................................. $ 886 $1,127 $1,330
Xbox 360 ................................................... 480 140 —
Xbox ....................................................... 157 400 516
PLAYSTATION 3 ............................................. 94 — —
Wii........................................................ 65 — —
Nintendo GameCube ........................................... 60 135 212
Other Consoles ............................................... — 1 10
Total Consoles .............................................. 1,742 1,803 2,068
PC .......................................................... 498 418 531
Mobility
PSP........................................................ 258 252 18
Cellular Handsets .............................................. 140 19 —
Nintendo DS ................................................. 104 67 23
Game Boy Advance and Game Boy Color ........................... 38 55 77
Total Mobility .............................................. 540 393 118
Co-publishing and Distribution...................................... 175 213 283
Internet Services, Licensing and Other
Subscription Services ........................................... 79 61 55
Licensing, Advertising and Other .................................. 57 63 74
Total Internet Services, Licensing and Other ........................ 136 124 129
Total Net Revenue ............................................... $3,091 $2,951 $3,129
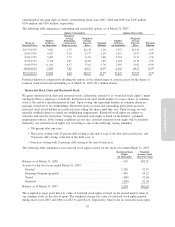
Information about our operations in North America, Europe and Asia as of and for the fiscal years ended
March 31, 2007, 2006 and 2005 is presented below (in millions):
North
America Europe Asia Total
Year ended March 31, 2007
Net revenue from unaffiliated customers ........................ $1,666 $1,261 $164 $3,091
Long-lived assets ......................................... 1,150 267 11 1,428
Year ended March 31, 2006
Net revenue from unaffiliated customers ........................ $1,584 $1,174 $193 $2,951
Long-lived assets ......................................... 1,061 203 7 1,271
Year ended March 31, 2005
Net revenue from unaffiliated customers ........................ $1,665 $1,284 $180 $3,129
Long-lived assets ......................................... 314 218 10 542
Substantially all of our North America net revenue is generated in the United States.
Our direct sales to Wal-Mart Stores, Inc. represented approximately 13 percent of total net revenue in both
fiscal 2007 and 2006 and 14 percent of total net revenue in fiscal 2005. Our direct sales to GameStop Corp.
represented approximately 12 percent of total net revenue in fiscal 2007.
104