Electronic Arts 2007 Annual Report Download - page 120
Download and view the complete annual report
Please find page 120 of the 2007 Electronic Arts annual report below. You can navigate through the pages in the report by either clicking on the pages listed below, or by using the keyword search tool below to find specific information within the annual report.-
 1
1 -
2
-
3
-
4
-
5
-
6
-
7
-
8
-
9
-
10
-
11
-
12
-
13
-
14
-
15
-
16
-
17
-
18
-
19
-
20
-
21
-
22
-
23
-
24
-
25
-
26
-
27
-
28
-
29
-
30
-
31
-
32
-
33
-
34
-
35
-
36
-
37
-
38
-
39
-
40
-
41
-
42
-
43
-
44
-
45
-
46
-
47
-
48
-
49
-
50
-
51
-
52
-
53
-
54
-
55
-
56
-
57
-
58
-
59
-
60
-
61
-
62
-
63
-
64
-
65
-
66
-
67
-
68
-
69
-
70
-
71
-
72
-
73
-
74
-
75
-
76
-
77
-
78
-
79
-
80
-
81
-
82
-
83
-
84
-
85
-
86
-
87
-
88
-
89
-
90
-
91
-
92
-
93
-
94
-
95
-
96
-
97
-
98
-
99
-
100
-
101
-
102
-
103
-
104
-
105
-
106
-
107
-
108
-
109
-
 110
110 -
 111
111 -
 112
112 -
 113
113 -
 114
114 -
 115
115 -
 116
116 -
 117
117 -
 118
118 -
 119
119 -
 120
120 -
 121
121 -
 122
122 -
 123
123 -
 124
124 -
 125
125 -
 126
126 -
 127
127 -
 128
128 -
 129
129 -
 130
130 -
131
-
132
-
133
-
134
-
135
-
136
-
137
-
138
-
139
-
140
-
141
-
142
-
143
-
144
-
145
-
146
-
147
-
148
-
149
-
150
-
151
-
152
-
153
-
154
-
155
-
156
-
157
-
158
-
159
-
160
-
161
-
162
-
163
-
164
-
165
-
166
-
167
-
168
-
169
-
170
-
171
-
172
-
173
-
174
-
175
-
176
-
177
-
178
-
179
-
180
-
181
-
182
-
183
-
184
-
185
-
186
-
187
-
188
-
189
-
190
-
191
-
192
-
193
 |
 |

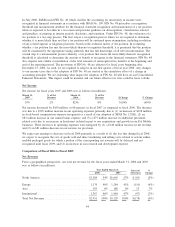
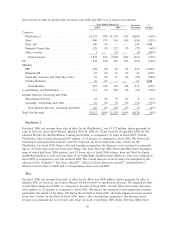
Our total net revenue by product line for fiscal years 2006 and 2005 was as follows (in millions):
2006 2005
Increase/
(Decrease)
%
Change
Year Ended March 31,
Consoles
PlayStation 2 ............................. $1,127 38% $1,330 43% $(203) (15%)
Xbox . . . ................................ 400 13% 516 16% (116) (22%)
Xbox 360 ............................... 140 5% — — 140 N/M
Nintendo GameCube ....................... 135 5% 212 7% (77) (36%)
Other consoles ............................ 1 — 10 — (9) (90%)
Total Consoles .......................... 1,803 61% 2,068 66% (265) (13%)
PC ...................................... 418 14% 531 17% (113) (21%)
Mobility
PSP.................................... 252 9% 18 1% 234 1,300%
Nintendo DS ............................. 67 2% 23 1% 44 191%
Game Boy Advance and Game Boy Color ....... 55 2% 77 2% (22) (29%)
Cellular Handsets .......................... 19 1% — — 19 N/M
Total Mobility .......................... 393 14% 118 4% 275 233%
Co-publishing and Distribution .................. 213 7% 283 9% (70) (25%)
Internet Services, Licensing and Other
Subscription Services ....................... 61 2% 55 2% 6 11%
Licensing, Advertising and Other .............. 63 2% 74 2% (11) (15%)
Total Internet Services, Licensing and Other . . . . 124 4% 129 4% (5) (4%)
Total Net Revenue ........................... $2,951 100% $3,129 100% $(178) (6%)
PlayStation 2
For fiscal 2006, net revenue from sales of titles for the PlayStation 2 was $1,127 million, driven primarily by
sales of Need for Speed Most Wanted, Madden NFL 06, FIFA 06, NCAA Football 06 and NBA LIVE 06. We
released 28 titles for the PlayStation 2 during fiscal 2006, as compared to 27 titles in fiscal 2005. Overall,
PlayStation 2 net revenue decreased $203 million, or 15 percent, as compared to fiscal 2005. We believe the
transition to next-generation consoles adversely impacted our net revenue from sales of titles for the
PlayStation 2 in fiscal 2006. From a title and franchise perspective, the decrease in net revenue was primarily
due to (1) lower sales from our Lord of the Rings, The Urbz, Def Jam, NFL Street and NBA Street franchises,
none of which had fiscal 2006 releases, and (2) lower sales of fiscal 2006 releases from our Need for Speed
and Bond franchises as well as lower sales of our Fight Night franchise from which two titles were released in
fiscal 2005 as compared to one title in fiscal 2006. The overall decrease in net revenue was mitigated by the
releases of The Godfather
TM
The Game,BLACK
TM
,Medal of Honor European Assault
TM
, and Battlefield 2:
Modern Combat none of which had a corresponding release in fiscal 2005.
Xbox
For fiscal 2006, net revenue from sales of titles for the Xbox was $400 million, driven primarily by sales of
Madden NFL 06, Need for Speed Most Wanted, NCAA Football 06 and Burnout Revenge. We released 28 titles
for the Xbox during fiscal 2006, as compared to 26 titles in fiscal 2005. Overall, Xbox net revenue decreased
$116 million, or 22 percent, as compared to fiscal 2005. We believe the transition to next-generation consoles,
particularly the launch of the Xbox 360 during the last half of fiscal 2006, adversely impacted our net revenue
from sales of titles for the Xbox in fiscal 2006. From a title and franchise perspective, the decrease in net
revenue was primarily due to (1) lower sales from our Lord of the Rings, NFL Street, Def Jam, NBA Street
46