Electronic Arts 2007 Annual Report Download - page 176
Download and view the complete annual report
Please find page 176 of the 2007 Electronic Arts annual report below. You can navigate through the pages in the report by either clicking on the pages listed below, or by using the keyword search tool below to find specific information within the annual report.-
 1
1 -
2
-
3
-
4
-
5
-
6
-
7
-
8
-
9
-
10
-
11
-
12
-
13
-
14
-
15
-
16
-
17
-
18
-
19
-
20
-
21
-
22
-
23
-
24
-
25
-
26
-
27
-
28
-
29
-
30
-
31
-
32
-
33
-
34
-
35
-
36
-
37
-
38
-
39
-
40
-
41
-
42
-
43
-
44
-
45
-
46
-
47
-
48
-
49
-
50
-
51
-
52
-
53
-
54
-
55
-
56
-
57
-
58
-
59
-
60
-
61
-
62
-
63
-
64
-
65
-
66
-
67
-
68
-
69
-
70
-
71
-
72
-
73
-
74
-
75
-
76
-
77
-
78
-
79
-
80
-
81
-
82
-
83
-
84
-
85
-
86
-
87
-
88
-
89
-
90
-
91
-
92
-
93
-
94
-
95
-
96
-
97
-
98
-
99
-
100
-
101
-
102
-
103
-
104
-
105
-
106
-
107
-
108
-
109
-
110
-
111
-
112
-
113
-
114
-
115
-
116
-
117
-
118
-
119
-
120
-
121
-
122
-
123
-
124
-
125
-
126
-
127
-
128
-
129
-
130
-
131
-
132
-
133
-
134
-
135
-
136
-
137
-
138
-
139
-
140
-
141
-
142
-
143
-
144
-
145
-
146
-
147
-
148
-
149
-
150
-
151
-
152
-
153
-
154
-
155
-
156
-
157
-
158
-
159
-
160
-
161
-
162
-
163
-
164
-
165
-
 166
166 -
 167
167 -
 168
168 -
 169
169 -
 170
170 -
 171
171 -
 172
172 -
 173
173 -
 174
174 -
 175
175 -
 176
176 -
 177
177 -
 178
178 -
 179
179 -
 180
180 -
 181
181 -
 182
182 -
 183
183 -
 184
184 -
 185
185 -
 186
186 -
187
-
188
-
189
-
190
-
191
-
192
-
193
 |
 |

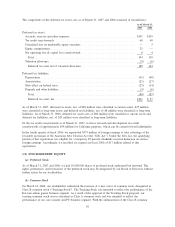
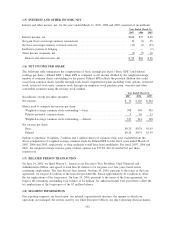
(15) INTEREST AND OTHER INCOME, NET
Interest and other income, net, for the years ended March 31, 2007, 2006 and 2005 consisted of (in millions):
2007 2006 2005
Year Ended March 31,
Interest income, net ................................................... $104 $75 $ 45
Net gain (loss) on foreign currency transactions .............................. 10 (1) 25
Net loss on foreign currency forward contracts ............................... (13) (3) (23)
Ineffective portion of hedging ........................................... — — (1)
Other income (expense), net ............................................. (2) (7) 10
Interest and other income, net .......................................... $ 99 $64 $56
(16) NET INCOME PER SHARE
The following table summarizes the computations of basic earnings per share (“Basic EPS”) and diluted
earnings per share (“Diluted EPS”). Basic EPS is computed as net income divided by the weighted-average
number of common shares outstanding for the period. Diluted EPS reflects the potential dilution that could
occur from common shares issuable through stock-based compensation plans including stock options, restricted
stock, restricted stock units, common stock through our employee stock purchase plan, warrants and other
convertible securities using the treasury stock method.
(In millions, except per share amounts) 2007 2006 2005
Year Ended March 31,
Net income ....................................................... $ 76 $236 $504
Shares used to compute net income per share:
Weighted-average common stock outstanding — basic ..................... 308 304 305
Dilutive potential common shares .................................... 9 10 13
Weighted-average common stock outstanding — diluted .................... 317 314 318
Net income per share:
Basic ......................................................... $0.25 $0.78 $1.65
Diluted ........................................................ $0.24 $0.75 $1.59
Options to purchase 16 million, 7 million and 1 million shares of common stock were excluded from the
above computation of weighted-average common stock for Diluted EPS for the fiscal years ended March 31,
2007, 2006 and 2005, respectively, as their inclusion would have been antidilutive. For fiscal 2007, 2006 and
2005, the weighted-average exercise price of these options was $55.84, $63.34 and $63.63 per share,
respectively.
(17) RELATED PERSON TRANSACTION
On June 24, 2002, we hired Warren C. Jenson as our Executive Vice President, Chief Financial and
Administrative Officer and agreed to loan him $4 million to be forgiven over four years based on his
continuing employment. The loan did not bear interest. On June 24, 2004, pursuant to the terms of the loan
agreement, we forgave $2 million of the loan and provided Mr. Jenson approximately $1.6 million to offset
the tax implications of the forgiveness. On June 24, 2006, pursuant to the terms of the loan agreement, we
forgave the remaining outstanding loan balance of $2 million. No additional funds were provided to offset the
tax implications of the forgiveness of the $2 million balance.
(18) SEGMENT INFORMATION
Our reporting segments are based upon: our internal organizational structure; the manner in which our
operations are managed; the criteria used by our Chief Executive Officer, our chief operating decision maker,
102