Electronic Arts 2007 Annual Report Download - page 111
Download and view the complete annual report
Please find page 111 of the 2007 Electronic Arts annual report below. You can navigate through the pages in the report by either clicking on the pages listed below, or by using the keyword search tool below to find specific information within the annual report.-
 1
1 -
2
-
3
-
4
-
5
-
6
-
7
-
8
-
9
-
10
-
11
-
12
-
13
-
14
-
15
-
16
-
17
-
18
-
19
-
20
-
21
-
22
-
23
-
24
-
25
-
26
-
27
-
28
-
29
-
30
-
31
-
32
-
33
-
34
-
35
-
36
-
37
-
38
-
39
-
40
-
41
-
42
-
43
-
44
-
45
-
46
-
47
-
48
-
49
-
50
-
51
-
52
-
53
-
54
-
55
-
56
-
57
-
58
-
59
-
60
-
61
-
62
-
63
-
64
-
65
-
66
-
67
-
68
-
69
-
70
-
71
-
72
-
73
-
74
-
75
-
76
-
77
-
78
-
79
-
80
-
81
-
82
-
83
-
84
-
85
-
86
-
87
-
88
-
89
-
90
-
91
-
92
-
93
-
94
-
95
-
96
-
97
-
98
-
99
-
100
-
 101
101 -
 102
102 -
 103
103 -
 104
104 -
 105
105 -
 106
106 -
 107
107 -
 108
108 -
 109
109 -
 110
110 -
 111
111 -
 112
112 -
 113
113 -
 114
114 -
 115
115 -
 116
116 -
 117
117 -
 118
118 -
 119
119 -
 120
120 -
 121
121 -
122
-
123
-
124
-
125
-
126
-
127
-
128
-
129
-
130
-
131
-
132
-
133
-
134
-
135
-
136
-
137
-
138
-
139
-
140
-
141
-
142
-
143
-
144
-
145
-
146
-
147
-
148
-
149
-
150
-
151
-
152
-
153
-
154
-
155
-
156
-
157
-
158
-
159
-
160
-
161
-
162
-
163
-
164
-
165
-
166
-
167
-
168
-
169
-
170
-
171
-
172
-
173
-
174
-
175
-
176
-
177
-
178
-
179
-
180
-
181
-
182
-
183
-
184
-
185
-
186
-
187
-
188
-
189
-
190
-
191
-
192
-
193
 |
 |

sites with our game content, allowing other companies to manufacture and sell our products in conjunction
with other products, and selling advertisements on our online web pages and in our games.
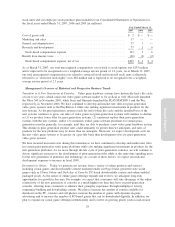
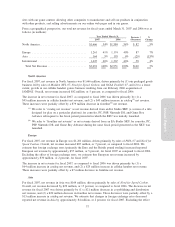
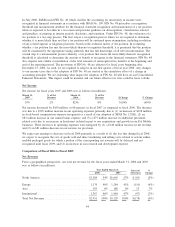
From a geographical perspective, our total net revenue for fiscal years ended March 31, 2007 and 2006 was as
follows (in millions):
2007 2006
Increase /
(Decrease)
%
Change
Year Ended March 31,
North America.............................. $1,666 54% $1,584 54% $ 82 5%
Europe . . . ................................ 1,261 41% 1,174 40% 87 7%
Asia ..................................... 164 5% 193 6% (29) (15%)
International ............................... 1,425 46% 1,367 46% 58 4%
Total Net Revenue ......................... $3,091 100% $2,951 100% $140 5%
North America
For fiscal 2007, net revenue in North America was $1,666 million, driven primarily by (1) our packaged goods
business led by sales of Madden NFL 07,Need for Speed Carbon, and NCAA Football 07, and (2) to a lesser
extent, growth in our cellular handset games business resulting from our February 2006 acquisition of
JAMDAT. Overall, net revenue increased $82 million, or 5 percent, as compared to fiscal 2006.
The increase in net revenue for fiscal 2007, as compared to fiscal 2006 was driven primarily by (1) a
$95 million increase in cellular handset net revenue, and (2) a $43 million increase in catalog
(a)
net revenue.
These increases were partially offset by a $79 million decrease in frontline
(b)
net revenue.
(a)
We refer to “catalog net revenue” as net revenue derived from an EA Studio SKU (a version of a title
designed for play on a particular platform) for consoles, PC, PSP, Nintendo DS, and Game Boy
Advance subsequent to the fiscal period presented in which the SKU was initially launched.
(b)
We refer to “frontline net revenue” as net revenue derived from an EA Studio SKU for consoles, PC,
PSP, Nintendo DS, and Game Boy Advance during the same fiscal period presented as the SKU was
launched.
Europe
For fiscal 2007, net revenue in Europe was $1,261 million, driven primarily by sales of FIFA 07 and Need for
Speed Carbon. Overall, net revenue increased $87 million, or 7 percent, as compared to fiscal 2006. We
estimate that foreign exchange rates (primarily the Euro and the British pound sterling) increased reported
European net revenue by approximately $57 million, or 5 percent, for fiscal 2007 as compared to fiscal 2006.
Excluding the effect of foreign exchange rates, we estimate that European net revenue increased by
approximately $30 million, or 2 percent, for fiscal 2007.
The increase in net revenue for fiscal 2007, as compared to fiscal 2006 was driven primarily by (1) a
$64 million increase in catalog net revenue, and (2) a $25 million increase in cellular handset net revenue.
These increases were partially offset by a $7 million decrease in frontline net revenue.
Asia
For fiscal 2007, net revenue in Asia was $164 million, driven primarily by sales of Need for Speed Carbon.
Overall, net revenue decreased by $29 million, or 15 percent, as compared to fiscal 2006. The decrease in net
revenue for fiscal 2007 was driven primarily by (1) a $21 million decrease in co-publishing and distribution
net revenue, and (2) a $20 million decrease in frontline net revenue. These decreases were partially offset by a
$13 million increase in catalog net revenue. We estimate that changes in foreign exchange rates decreased
reported net revenue in Asia by approximately $4 million, or 2 percent, for fiscal 2007. Excluding the effect
Annual Report
37