Electronic Arts 2007 Annual Report Download - page 112
Download and view the complete annual report
Please find page 112 of the 2007 Electronic Arts annual report below. You can navigate through the pages in the report by either clicking on the pages listed below, or by using the keyword search tool below to find specific information within the annual report.-
 1
1 -
2
-
3
-
4
-
5
-
6
-
7
-
8
-
9
-
10
-
11
-
12
-
13
-
14
-
15
-
16
-
17
-
18
-
19
-
20
-
21
-
22
-
23
-
24
-
25
-
26
-
27
-
28
-
29
-
30
-
31
-
32
-
33
-
34
-
35
-
36
-
37
-
38
-
39
-
40
-
41
-
42
-
43
-
44
-
45
-
46
-
47
-
48
-
49
-
50
-
51
-
52
-
53
-
54
-
55
-
56
-
57
-
58
-
59
-
60
-
61
-
62
-
63
-
64
-
65
-
66
-
67
-
68
-
69
-
70
-
71
-
72
-
73
-
74
-
75
-
76
-
77
-
78
-
79
-
80
-
81
-
82
-
83
-
84
-
85
-
86
-
87
-
88
-
89
-
90
-
91
-
92
-
93
-
94
-
95
-
96
-
97
-
98
-
99
-
100
-
101
-
 102
102 -
 103
103 -
 104
104 -
 105
105 -
 106
106 -
 107
107 -
 108
108 -
 109
109 -
 110
110 -
 111
111 -
 112
112 -
 113
113 -
 114
114 -
 115
115 -
 116
116 -
 117
117 -
 118
118 -
 119
119 -
 120
120 -
 121
121 -
 122
122 -
123
-
124
-
125
-
126
-
127
-
128
-
129
-
130
-
131
-
132
-
133
-
134
-
135
-
136
-
137
-
138
-
139
-
140
-
141
-
142
-
143
-
144
-
145
-
146
-
147
-
148
-
149
-
150
-
151
-
152
-
153
-
154
-
155
-
156
-
157
-
158
-
159
-
160
-
161
-
162
-
163
-
164
-
165
-
166
-
167
-
168
-
169
-
170
-
171
-
172
-
173
-
174
-
175
-
176
-
177
-
178
-
179
-
180
-
181
-
182
-
183
-
184
-
185
-
186
-
187
-
188
-
189
-
190
-
191
-
192
-
193
 |
 |

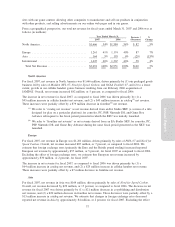
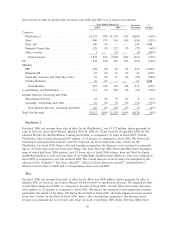
of foreign exchange rates, we estimate that Asia net revenue decreased by approximately $25 million, or
13 percent, for fiscal 2007 as compared to fiscal 2006.
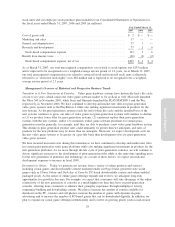
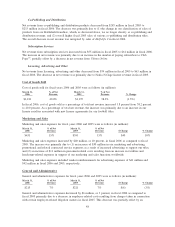
Our total net revenue by platform for fiscal years 2007 and 2006 was as follows (in millions):
2007 2006
Increase/
(Decrease)
%
Change
Year Ended March 31,
Consoles
PlayStation 2 ............................. $ 886 29% $1,127 38% $(241) (21%)
Xbox 360 ............................... 480 15% 140 5% 340 243%
Xbox . . . ................................ 157 5% 400 13% (243) (61%)
PLAYSTATION 3 ......................... 94 3% — — 94 N/M
Wii.................................... 65 2% — — 65 N/M
Nintendo GameCube ....................... 60 2% 135 5% (75) (56%)
Other Consoles ........................... — — 1 — (1) (100%)
Total Consoles .......................... 1,742 56% 1,803 61% (61) (3%)
PC ...................................... 498 16% 418 14% 80 19%
Mobility
PSP.................................... 258 8% 252 9% 6 2%
Cellular Handsets .......................... 140 6% 19 1% 121 637%
Nintendo DS ............................. 104 3% 67 2% 37 55%
Game Boy Advance ........................ 38 1% 55 2% (17) (31%)
Total Mobility .......................... 540 18% 393 14% 147 37%
Co-publishing and Distribution .................. 175 6% 213 7% (38) (18%)
Internet Services, Licensing and Other
Subscription Services ....................... 79 2% 61 2% 18 30%
Licensing, Advertising and Other .............. 57 2% 63 2% (6) (10%)
Total Internet Services, Licensing
and Other ............................ 136 4% 124 4% 12 10%
Total Net Revenue ......................... $3,091 100% $2,951 100% $ 140 5%
PlayStation 2
For fiscal 2007, net revenue from sales of titles for the PlayStation 2 was $886 million, driven primarily by
sales of Madden NFL 07, Need for Speed Carbon, and FIFA 07. Overall, PlayStation 2 net revenue decreased
$241 million, or 21 percent, compared to fiscal 2006. Although we are unable to specifically quantify the
impact, we believe the decrease was primarily due to the transition to new generation consoles.
We expect PlayStation 2-related net revenue to continue to decline in fiscal 2008 as consumers increasingly
migrate to new platforms, we publish fewer titles (as compared to fiscal 2007) and we defer a greater
percentage of our net revenue due to the change in our online-enabled packaged goods business model.
Xbox 360
The Xbox 360 was launched in North America, Europe and Japan during the three months ended December 31,
2005 and in the rest of Asia during the three months ended March 31, 2006. For fiscal 2007, net revenue from
sales of titles for the Xbox 360 was $480 million driven primarily by sales of Madden NFL 07, Need for
Speed Carbon, and FIFA 07.
We expect net revenue from sales of titles for the Xbox 360 to increase as the installed base grows and we
release more titles.
38