Electronic Arts 2007 Annual Report Download - page 122
Download and view the complete annual report
Please find page 122 of the 2007 Electronic Arts annual report below. You can navigate through the pages in the report by either clicking on the pages listed below, or by using the keyword search tool below to find specific information within the annual report.-
 1
1 -
2
-
3
-
4
-
5
-
6
-
7
-
8
-
9
-
10
-
11
-
12
-
13
-
14
-
15
-
16
-
17
-
18
-
19
-
20
-
21
-
22
-
23
-
24
-
25
-
26
-
27
-
28
-
29
-
30
-
31
-
32
-
33
-
34
-
35
-
36
-
37
-
38
-
39
-
40
-
41
-
42
-
43
-
44
-
45
-
46
-
47
-
48
-
49
-
50
-
51
-
52
-
53
-
54
-
55
-
56
-
57
-
58
-
59
-
60
-
61
-
62
-
63
-
64
-
65
-
66
-
67
-
68
-
69
-
70
-
71
-
72
-
73
-
74
-
75
-
76
-
77
-
78
-
79
-
80
-
81
-
82
-
83
-
84
-
85
-
86
-
87
-
88
-
89
-
90
-
91
-
92
-
93
-
94
-
95
-
96
-
97
-
98
-
99
-
100
-
101
-
102
-
103
-
104
-
105
-
106
-
107
-
108
-
109
-
110
-
111
-
 112
112 -
 113
113 -
 114
114 -
 115
115 -
 116
116 -
 117
117 -
 118
118 -
 119
119 -
 120
120 -
 121
121 -
 122
122 -
 123
123 -
 124
124 -
 125
125 -
 126
126 -
 127
127 -
 128
128 -
 129
129 -
 130
130 -
 131
131 -
 132
132 -
133
-
134
-
135
-
136
-
137
-
138
-
139
-
140
-
141
-
142
-
143
-
144
-
145
-
146
-
147
-
148
-
149
-
150
-
151
-
152
-
153
-
154
-
155
-
156
-
157
-
158
-
159
-
160
-
161
-
162
-
163
-
164
-
165
-
166
-
167
-
168
-
169
-
170
-
171
-
172
-
173
-
174
-
175
-
176
-
177
-
178
-
179
-
180
-
181
-
182
-
183
-
184
-
185
-
186
-
187
-
188
-
189
-
190
-
191
-
192
-
193
 |
 |

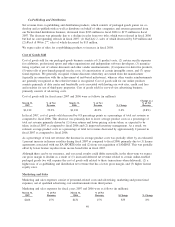
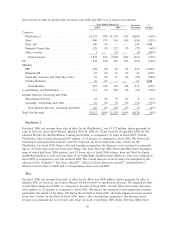
Co-Publishing and Distribution
Net revenue from co-publishing and distribution products decreased from $283 million in fiscal 2005 to
$213 million in fiscal 2006. The decrease was primarily due to (1) the change in our classification of sales of
products from our Battlefield franchise, which, as discussed above, we no longer classify as co-publishing and
distribution revenue, and (2) overall higher fiscal 2005 sales of various co-publishing and distribution titles.
The overall decrease in net revenue was mitigated by sales of Half-Life 2 in fiscal 2006.
Subscription Services
Net revenue from subscription services increased from $55 million in fiscal 2005 to $61 million in fiscal 2006.
The increase in net revenue was primarily due to an increase in the number of paying subscribers to Club
Pogo
TM
, partially offset by a decrease in net revenue from Ultima Online.
Licensing, Advertising and Other
Net revenue from licensing, advertising and other decreased from $74 million in fiscal 2005 to $63 million in
fiscal 2006. The decrease in net revenue was primarily due to Nokia N-Gage license revenue in fiscal 2005.
Cost of Goods Sold
Cost of goods sold for fiscal years 2006 and 2005 were as follows (in millions):
March 31,
2006
%ofNet
Revenue
March 31,
2005
%ofNet
Revenue % Change
$1,181 40.0% $1,197 38.2% (1.3%)
In fiscal 2006, cost of goods sold as a percentage of total net revenue increased 1.8 percent from 38.2 percent
to 40.0 percent. As a percentage of total net revenue, the increase was primarily due to an increase in our
license royalties associated with new license agreements for our football titles.
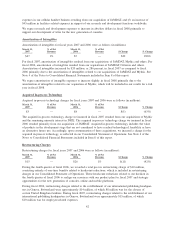
Marketing and Sales
Marketing and sales expenses for fiscal years 2006 and 2005 were as follows (in millions):
March 31,
2006
%ofNet
Revenue
March 31,
2005
%ofNet
Revenue $ Change % Change
$431 15% $391 13% $40 10%
Marketing and sales expenses increased by $40 million, or 10 percent, in fiscal 2006 as compared to fiscal
2005. The increase was primarily due to (1) an increase of $30 million in our marketing and advertising,
promotional and related contracted service expenses as a result of increased advertising to support our titles,
and (2) an increase of $11 million in personnel-related costs resulting from an increase in facilities and
headcount-related expenses in support of our marketing and sales functions worldwide.
Marketing and sales expenses included vendor reimbursements for advertising expenses of $41 million and
$42 million in fiscal 2006 and 2005, respectively.
General and Administrative
General and administrative expenses for fiscal years 2006 and 2005 were as follows (in millions):
March 31,
2006
%ofNet
Revenue
March 31,
2005
%ofNet
Revenue $ Change % Change
$215 7% $221 7% $(6) (3%)
General and administrative expenses decreased by $6 million, or 3 percent, in fiscal 2006 as compared to
fiscal 2005 primarily due to a decrease in employee-related costs resulting from charges taken in connection
with certain employee-related litigation matters in fiscal 2005. This decrease was partially offset by an
48