Electronic Arts 2008 Annual Report Download - page 116
Download and view the complete annual report
Please find page 116 of the 2008 Electronic Arts annual report below. You can navigate through the pages in the report by either clicking on the pages listed below, or by using the keyword search tool below to find specific information within the annual report.-
 1
1 -
2
-
3
-
4
-
5
-
6
-
7
-
8
-
9
-
10
-
11
-
12
-
13
-
14
-
15
-
16
-
17
-
18
-
19
-
20
-
21
-
22
-
23
-
24
-
25
-
26
-
27
-
28
-
29
-
30
-
31
-
32
-
33
-
34
-
35
-
36
-
37
-
38
-
39
-
40
-
41
-
42
-
43
-
44
-
45
-
46
-
47
-
48
-
49
-
50
-
51
-
52
-
53
-
54
-
55
-
56
-
57
-
58
-
59
-
60
-
61
-
62
-
63
-
64
-
65
-
66
-
67
-
68
-
69
-
70
-
71
-
72
-
73
-
74
-
75
-
76
-
77
-
78
-
79
-
80
-
81
-
82
-
83
-
84
-
85
-
86
-
87
-
88
-
89
-
90
-
91
-
92
-
93
-
94
-
95
-
96
-
97
-
98
-
99
-
100
-
101
-
102
-
103
-
104
-
105
-
 106
106 -
 107
107 -
 108
108 -
 109
109 -
 110
110 -
 111
111 -
 112
112 -
 113
113 -
 114
114 -
 115
115 -
 116
116 -
 117
117 -
 118
118 -
 119
119 -
 120
120 -
 121
121 -
 122
122 -
 123
123 -
 124
124 -
 125
125 -
 126
126 -
127
-
128
-
129
-
130
-
131
-
132
-
133
-
134
-
135
-
136
-
137
-
138
-
139
-
140
-
141
-
142
-
143
-
144
-
145
-
146
-
147
-
148
-
149
-
150
-
151
-
152
-
153
-
154
-
155
-
156
-
157
-
158
-
159
-
160
-
161
-
162
-
163
-
164
-
165
-
166
-
167
-
168
-
169
-
170
-
171
-
172
-
173
-
174
-
175
-
176
-
177
-
178
-
179
-
180
-
181
-
182
-
183
-
184
-
185
-
186
-
187
-
188
-
189
-
190
-
191
-
192
-
193
-
194
-
195
-
196
 |
 |

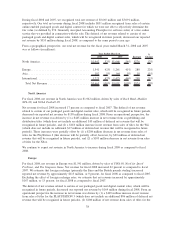
proportion of sales in fiscal 2008 from our owned intellectual property franchises that have lower royalty rates
as compared to fiscal 2007.
Although there can be no assurance, and our actual results could differ materially, in the short term we expect
our gross margin as a percentage of total net revenue to increase in fiscal 2009 as compared to fiscal 2008 as
a result of (1) a decrease in the change in deferred net revenue related to certain online-enabled packaged
goods (we expense the cost of goods sold related to these transactions when delivered) and (2) a favorable mix
of EA Studio revenue.
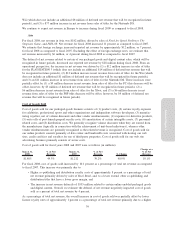
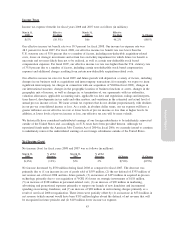
Marketing and Sales
Marketing and sales expenses consist of personnel-related costs and advertising, marketing and promotional
expenses, net of qualified advertising cost reimbursements from third parties.
Marketing and sales expenses for fiscal years 2008 and 2007 were as follows (in millions):
March 31,
2008
% of Net
Revenue
March 31,
2007
% of Net
Revenue $ Change % Change
$588 16% $466 15% $122 26%
As a percentage of net revenue, marketing and sales expenses were adversely impacted by our deferral of net
revenue related to online-enabled packaged goods and digital content during fiscal 2008.
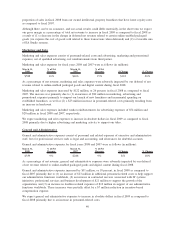
Marketing and sales expenses increased by $122 million, or 26 percent, in fiscal 2008 as compared to fiscal
2007. The increase was primarily due to (1) an increase of $90 million in marketing, advertising and
promotional expenses primarily to support our launch of new franchises and incremental spending on
established franchises, as well as (2) a $23 million increase in personnel-related costs primarily resulting from
an increase in headcount.
Marketing and sales expenses included vendor reimbursements for advertising expenses of $54 million and
$28 million in fiscal 2008 and 2007, respectively.
We expect marketing and sales expenses to increase in absolute dollars in fiscal 2009 as compared to fiscal
2008 primarily due to higher advertising and marketing activity to support our titles.
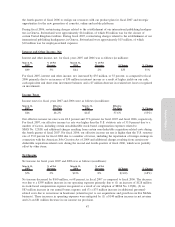
General and Administrative
General and administrative expenses consist of personnel and related expenses of executive and administrative
staff, fees for professional services such as legal and accounting, and allowances for doubtful accounts.
General and administrative expenses for fiscal years 2008 and 2007 were as follows (in millions):
March 31,
2008
% of Net
Revenue
March 31,
2007
% of Net
Revenue $ Change % Change
$339 9% $288 9% $51 18%
As a percentage of net revenue, general and administrative expenses were adversely impacted by our deferral
of net revenue related to online-enabled packaged goods and digital content during fiscal 2008.
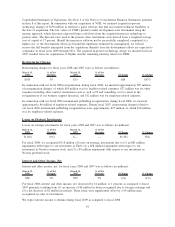
General and administrative expenses increased by $51 million, or 18 percent, in fiscal 2008 as compared to
fiscal 2007 primarily due to (1) an increase of $23 million in additional personnel-related costs to help support
our administrative functions worldwide, (2) an increase in contracted services associated with IT systems
initiatives, professional services and business development of $21 million to support the growth of the
organization, and (3) an increase in facilities-related expenses of $12 million in support of our administrative
functions worldwide. These increases were partially offset by a $7 million reduction in incentive-based
compensation expense.
We expect general and administrative expenses to increase in absolute dollars in fiscal 2009 as compared to
fiscal 2008 primarily due to an increase in personnel-related costs.
40