Electronic Arts 2008 Annual Report Download - page 134
Download and view the complete annual report
Please find page 134 of the 2008 Electronic Arts annual report below. You can navigate through the pages in the report by either clicking on the pages listed below, or by using the keyword search tool below to find specific information within the annual report.-
 1
1 -
2
-
3
-
4
-
5
-
6
-
7
-
8
-
9
-
10
-
11
-
12
-
13
-
14
-
15
-
16
-
17
-
18
-
19
-
20
-
21
-
22
-
23
-
24
-
25
-
26
-
27
-
28
-
29
-
30
-
31
-
32
-
33
-
34
-
35
-
36
-
37
-
38
-
39
-
40
-
41
-
42
-
43
-
44
-
45
-
46
-
47
-
48
-
49
-
50
-
51
-
52
-
53
-
54
-
55
-
56
-
57
-
58
-
59
-
60
-
61
-
62
-
63
-
64
-
65
-
66
-
67
-
68
-
69
-
70
-
71
-
72
-
73
-
74
-
75
-
76
-
77
-
78
-
79
-
80
-
81
-
82
-
83
-
84
-
85
-
86
-
87
-
88
-
89
-
90
-
91
-
92
-
93
-
94
-
95
-
96
-
97
-
98
-
99
-
100
-
101
-
102
-
103
-
104
-
105
-
106
-
107
-
108
-
109
-
110
-
111
-
112
-
113
-
114
-
115
-
116
-
117
-
118
-
119
-
120
-
121
-
122
-
123
-
 124
124 -
 125
125 -
 126
126 -
 127
127 -
 128
128 -
 129
129 -
 130
130 -
 131
131 -
 132
132 -
 133
133 -
 134
134 -
 135
135 -
 136
136 -
 137
137 -
 138
138 -
 139
139 -
 140
140 -
 141
141 -
 142
142 -
 143
143 -
 144
144 -
145
-
146
-
147
-
148
-
149
-
150
-
151
-
152
-
153
-
154
-
155
-
156
-
157
-
158
-
159
-
160
-
161
-
162
-
163
-
164
-
165
-
166
-
167
-
168
-
169
-
170
-
171
-
172
-
173
-
174
-
175
-
176
-
177
-
178
-
179
-
180
-
181
-
182
-
183
-
184
-
185
-
186
-
187
-
188
-
189
-
190
-
191
-
192
-
193
-
194
-
195
-
196
 |
 |

stockholders’ equity. Our portfolio of short-term investments consisted of the following investment categories,
summarized by fair value as of March 31, 2008 and 2007 (in millions):
2008 2007
As of March 31,
U.S. agency securities ..................................................... $266 $ 264
Corporate bonds ......................................................... 231 226
U.S. Treasury securities .................................................... 161 92
Asset-backed securities .................................................... 64 108
Commercial paper ........................................................ 12 574
Total short-term investments ............................................... $734 $1,264
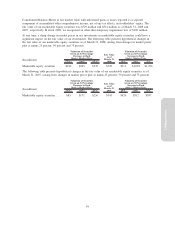
Notwithstanding our efforts to manage interest rate risks, there can be no assurance that we will be adequately
protected against risks associated with interest rate fluctuations. At any time, a sharp change in interest rates
could have a significant impact on the fair value of our investment portfolio. The following table presents the
hypothetical changes in fair value in our short-term investment portfolio as of March 31, 2008, arising from
potential changes in interest rates. The modeling technique estimates the change in fair value from immediate
hypothetical parallel shifts in the yield curve of plus or minus 50 basis points (“BPS”), 100 BPS, and 150
BPS.
(In millions) (150 BPS) (100 BPS) (50 BPS)
Fair Value
as of
March 31,
2008 50 BPS 100 BPS 150 BPS
Valuation of Securities
Given an Interest Rate
Decrease of X Basis Points
Valuation of Securities
Given an Interest Rate
Increase of X Basis Points
U.S. agency securities ........ $273 $270 $268 $266 $263 $261 $258
Corporate bonds . . .......... 235 234 233 231 230 229 227
U.S. Treasury securities ....... 166 164 163 161 160 158 156
Asset-backed securities ....... 64 64 64 64 64 63 63
Commercial paper . .......... 12 12 12 12 12 12 12
Total short-term
investments . . .......... $750 $744 $740 $734 $729 $723 $716
The following table presents the hypothetical changes in fair value in our short-term investment portfolio as of
March 31, 2007, arising from selected potential changes in interest rates.
(In millions) (150 BPS) (100 BPS) (50 BPS)
Fair Value
as of
March 31,
2007 50 BPS 100 BPS 150 BPS
Valuation of Securities
Given an Interest Rate
Decrease of X Basis Points
Valuation of Securities
Given an Interest Rate
Increase of X Basis Points
Commercial paper ........... $ 575 $ 575 $ 574 $ 574 $ 573 $ 573 $ 572
U.S. agency securities ........ 271 269 267 264 262 259 257
Corporate bonds ............ 231 230 228 226 225 223 222
Asset-backed securities . . . .... 110 109 108 108 107 106 105
U.S. Treasury securities . . . .... 95 94 94 92 92 91 90
Total short-term
investments ............ $1,282 $1,277 $1,271 $1,264 $1,259 $1,252 $1,246
Market Price Risk
The value of our equity investments in publicly traded companies is subject to market price volatility and
foreign currency risk for investments denominated in foreign currencies. As of March 31, 2008 and 2007, our
marketable equity securities were classified as available-for-sale and, consequently, were recorded in our
58