Electronic Arts 2008 Annual Report Download - page 140
Download and view the complete annual report
Please find page 140 of the 2008 Electronic Arts annual report below. You can navigate through the pages in the report by either clicking on the pages listed below, or by using the keyword search tool below to find specific information within the annual report.-
 1
1 -
2
-
3
-
4
-
5
-
6
-
7
-
8
-
9
-
10
-
11
-
12
-
13
-
14
-
15
-
16
-
17
-
18
-
19
-
20
-
21
-
22
-
23
-
24
-
25
-
26
-
27
-
28
-
29
-
30
-
31
-
32
-
33
-
34
-
35
-
36
-
37
-
38
-
39
-
40
-
41
-
42
-
43
-
44
-
45
-
46
-
47
-
48
-
49
-
50
-
51
-
52
-
53
-
54
-
55
-
56
-
57
-
58
-
59
-
60
-
61
-
62
-
63
-
64
-
65
-
66
-
67
-
68
-
69
-
70
-
71
-
72
-
73
-
74
-
75
-
76
-
77
-
78
-
79
-
80
-
81
-
82
-
83
-
84
-
85
-
86
-
87
-
88
-
89
-
90
-
91
-
92
-
93
-
94
-
95
-
96
-
97
-
98
-
99
-
100
-
101
-
102
-
103
-
104
-
105
-
106
-
107
-
108
-
109
-
110
-
111
-
112
-
113
-
114
-
115
-
116
-
117
-
118
-
119
-
120
-
121
-
122
-
123
-
124
-
125
-
126
-
127
-
128
-
129
-
 130
130 -
 131
131 -
 132
132 -
 133
133 -
 134
134 -
 135
135 -
 136
136 -
 137
137 -
 138
138 -
 139
139 -
 140
140 -
 141
141 -
 142
142 -
 143
143 -
 144
144 -
 145
145 -
 146
146 -
 147
147 -
 148
148 -
 149
149 -
 150
150 -
151
-
152
-
153
-
154
-
155
-
156
-
157
-
158
-
159
-
160
-
161
-
162
-
163
-
164
-
165
-
166
-
167
-
168
-
169
-
170
-
171
-
172
-
173
-
174
-
175
-
176
-
177
-
178
-
179
-
180
-
181
-
182
-
183
-
184
-
185
-
186
-
187
-
188
-
189
-
190
-
191
-
192
-
193
-
194
-
195
-
196
 |
 |

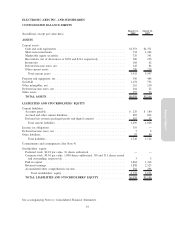
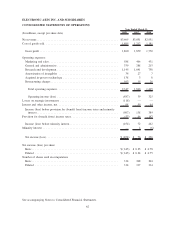
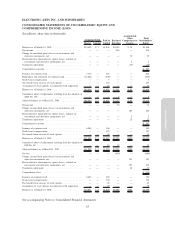
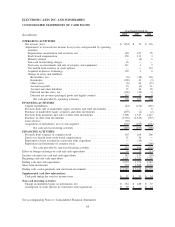
ELECTRONIC ARTS INC. AND SUBSIDIARIES
CONSOLIDATED STATEMENTS OF CASH FLOWS
(In millions) 2008 2007 2006
Year Ended March 31,
OPERATING ACTIVITIES
Net income (loss) . . ............................................. $ (454) $ 76 $ 236
Adjustments to reconcile net income (loss) to net cash provided by operating
activities:
Depreciation, amortization and accretion, net . . ........................ 164 147 95
Stock-based compensation ....................................... 150 133 3
Minority interest . ............................................. — (4) 6
Non-cash restructuring charges . ................................... 56 — —
Net losses on investments and sale of property and equipment. ............. 111 1 7
Tax benefit from exercise of stock options ............................ — — 133
Acquired in-process technology. ................................... 138 3 8
Change in assets and liabilities:
Receivables, net ............................................. (8) (18) 104
Inventories ................................................. (100) 12 (3)
Other assets . . . ............................................. (8) 46 (71)
Accounts payable ............................................ 23 (2) 31
Accrued and other liabilities . ................................... 71 34 30
Deferred income taxes, net . . ................................... (160) (54) 8
Deferred net revenue (packaged goods and digital content) . ............. 355 23 9
Net cash provided by operating activities . ........................ 338 397 596
INVESTING ACTIVITIES
Capital expenditures ............................................. (84) (176) (121)
Proceeds from sale of marketable equity securities and other investments ....... — — 6
Purchase of marketable equity securities and other investments . . ............. (275) (1) (2)
Proceeds from maturities and sales of short-term investments . . . ............. 2,306 1,315 1,427
Purchase of short-term investments ................................... (1,739) (1,522) (757)
Loan advance .................................................. (30) — —
Acquisition of subsidiaries, net of cash acquired . ........................ (607) (103) (661)
Net cash used in investing activities ............................. (429) (487) (108)
FINANCING ACTIVITIES
Proceeds from issuance of common stock . ............................. 192 168 206
Excess tax benefit from stock-based compensation ........................ 51 36 —
Repayment of note assumed in connection with acquisition ................. — (14) —
Repurchase and retirement of common stock ............................ — — (709)
Net cash provided by (used in) financing activities .................. 243 190 (503)
Effect of foreign exchange on cash and cash equivalents . . . .................. 30 29 (13)
Increase (decrease) in cash and cash equivalents . . . ........................ 182 129 (28)
Beginning cash and cash equivalents ................................... 1,371 1,242 1,270
Ending cash and cash equivalents . . . ................................... 1,553 1,371 1,242
Short-term investments ............................................. 734 1,264 1,030
Ending cash, cash equivalents and short-term investments . . .................. $2,287 $ 2,635 $2,272
Supplemental cash flow information:
Cash paid during the year for income taxes ............................. $ 31 $ 55 $ 24
Non-cash investing activities:
Change in unrealized gains on investments, net . . ........................ $ 154 $ 188 $ 37
Assumption of stock options in connection with acquisitions . . . ............. $ 59 $ — $ 14
See accompanying Notes to Consolidated Financial Statements
64