Electronic Arts 2008 Annual Report Download - page 121
Download and view the complete annual report
Please find page 121 of the 2008 Electronic Arts annual report below. You can navigate through the pages in the report by either clicking on the pages listed below, or by using the keyword search tool below to find specific information within the annual report.-
 1
1 -
2
-
3
-
4
-
5
-
6
-
7
-
8
-
9
-
10
-
11
-
12
-
13
-
14
-
15
-
16
-
17
-
18
-
19
-
20
-
21
-
22
-
23
-
24
-
25
-
26
-
27
-
28
-
29
-
30
-
31
-
32
-
33
-
34
-
35
-
36
-
37
-
38
-
39
-
40
-
41
-
42
-
43
-
44
-
45
-
46
-
47
-
48
-
49
-
50
-
51
-
52
-
53
-
54
-
55
-
56
-
57
-
58
-
59
-
60
-
61
-
62
-
63
-
64
-
65
-
66
-
67
-
68
-
69
-
70
-
71
-
72
-
73
-
74
-
75
-
76
-
77
-
78
-
79
-
80
-
81
-
82
-
83
-
84
-
85
-
86
-
87
-
88
-
89
-
90
-
91
-
92
-
93
-
94
-
95
-
96
-
97
-
98
-
99
-
100
-
101
-
102
-
103
-
104
-
105
-
106
-
107
-
108
-
109
-
110
-
 111
111 -
 112
112 -
 113
113 -
 114
114 -
 115
115 -
 116
116 -
 117
117 -
 118
118 -
 119
119 -
 120
120 -
 121
121 -
 122
122 -
 123
123 -
 124
124 -
 125
125 -
 126
126 -
 127
127 -
 128
128 -
 129
129 -
 130
130 -
 131
131 -
132
-
133
-
134
-
135
-
136
-
137
-
138
-
139
-
140
-
141
-
142
-
143
-
144
-
145
-
146
-
147
-
148
-
149
-
150
-
151
-
152
-
153
-
154
-
155
-
156
-
157
-
158
-
159
-
160
-
161
-
162
-
163
-
164
-
165
-
166
-
167
-
168
-
169
-
170
-
171
-
172
-
173
-
174
-
175
-
176
-
177
-
178
-
179
-
180
-
181
-
182
-
183
-
184
-
185
-
186
-
187
-
188
-
189
-
190
-
191
-
192
-
193
-
194
-
195
-
196
 |
 |

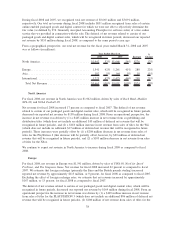
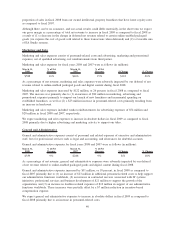
Cost of Goods Sold
Cost of goods sold for fiscal years 2007 and 2006 were as follows (in millions):
March 31,
2007
% of Net
Revenue
March 31,
2006
%ofNet
Revenue % Change
Change as a
% of Net
Revenue
$1,212 39.2% $1,181 40.0% 2.6% (0.8%)
In fiscal 2007, cost of goods sold decreased by 0.8 percentage points as a percentage of total net revenue as
compared to fiscal 2006. This decrease was primarily due to lower average product costs as a percentage of
total net revenue primarily driven by (1) fewer returns and lower pricing actions taken, or expected to be
taken, in fiscal 2007 as compared to fiscal 2006 and (2) improved inventory management. As a result, we
estimate average product costs as a percentage of total net revenue decreased by approximately 2 percent in
fiscal 2007 as compared to fiscal 2006.
As a percentage of total net revenue, the decrease in average product costs was partially offset by an estimated
1 percent increase in license royalties during fiscal 2007 as compared to fiscal 2006 primarily due to (1) license
agreements associated with our EA SPORTS titles and (2) our acquisition of JAMDAT. This was partially
offset by lower license royalties from movie-based titles in fiscal 2007.
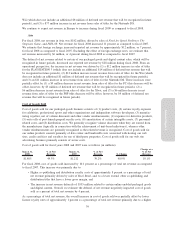
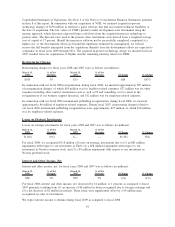
Marketing and Sales
Marketing and sales expenses for fiscal years 2007 and 2006 were as follows (in millions):
March 31,
2007
% of Net
Revenue
March 31,
2006
% of Net
Revenue $ Change % Change
$466 15% $431 15% $35 8%
Marketing and sales expenses increased by $35 million, or 8 percent, in fiscal 2007 as compared to fiscal
2006. The increase was primarily due to (1) an increase of $17 million in stock-based compensation expense
recognized as a result of our adoption of SFAS No. 123(R), (2) an increase of $10 million in our annual bonus
expense, and (3) $10 million in additional personnel-related costs primarily resulting from an increase in
headcount. These increases were partially offset by a decrease of $9 million in our marketing, advertising,
promotional and related services as a result of higher advertising in the prior year to support our product
releases, primarily from our Harry Potter and BLACK franchises.
Marketing and sales expenses included vendor reimbursements for advertising expenses of $28 million and
$41 million in fiscal 2007 and 2006, respectively.
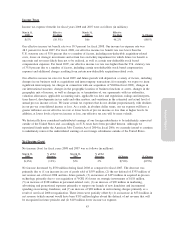
General and Administrative
General and administrative expenses for fiscal years 2007 and 2006 were as follows (in millions):
March 31,
2007
% of Net
Revenue
March 31,
2006
% of Net
Revenue $ Change % Change
$288 9% $215 7% $73 34%
General and administrative expenses increased by $73 million, or 34 percent, in fiscal 2007 as compared to
fiscal 2006 primarily due to (1) an increase of $36 million in stock-based compensation expense recognized as
a result of our adoption of SFAS No. 123(R), (2) a $14 million increase in our annual bonus expense, (3) an
$11 million increase in additional personnel-related costs to help support our administrative functions
worldwide, and (4) an increase of $11 million in professional and contracted services in support of our
technology infrastructure.
Annual Report
45