Electronic Arts 2008 Annual Report Download - page 119
Download and view the complete annual report
Please find page 119 of the 2008 Electronic Arts annual report below. You can navigate through the pages in the report by either clicking on the pages listed below, or by using the keyword search tool below to find specific information within the annual report.-
 1
1 -
2
-
3
-
4
-
5
-
6
-
7
-
8
-
9
-
10
-
11
-
12
-
13
-
14
-
15
-
16
-
17
-
18
-
19
-
20
-
21
-
22
-
23
-
24
-
25
-
26
-
27
-
28
-
29
-
30
-
31
-
32
-
33
-
34
-
35
-
36
-
37
-
38
-
39
-
40
-
41
-
42
-
43
-
44
-
45
-
46
-
47
-
48
-
49
-
50
-
51
-
52
-
53
-
54
-
55
-
56
-
57
-
58
-
59
-
60
-
61
-
62
-
63
-
64
-
65
-
66
-
67
-
68
-
69
-
70
-
71
-
72
-
73
-
74
-
75
-
76
-
77
-
78
-
79
-
80
-
81
-
82
-
83
-
84
-
85
-
86
-
87
-
88
-
89
-
90
-
91
-
92
-
93
-
94
-
95
-
96
-
97
-
98
-
99
-
100
-
101
-
102
-
103
-
104
-
105
-
106
-
107
-
108
-
 109
109 -
 110
110 -
 111
111 -
 112
112 -
 113
113 -
 114
114 -
 115
115 -
 116
116 -
 117
117 -
 118
118 -
 119
119 -
 120
120 -
 121
121 -
 122
122 -
 123
123 -
 124
124 -
 125
125 -
 126
126 -
 127
127 -
 128
128 -
 129
129 -
130
-
131
-
132
-
133
-
134
-
135
-
136
-
137
-
138
-
139
-
140
-
141
-
142
-
143
-
144
-
145
-
146
-
147
-
148
-
149
-
150
-
151
-
152
-
153
-
154
-
155
-
156
-
157
-
158
-
159
-
160
-
161
-
162
-
163
-
164
-
165
-
166
-
167
-
168
-
169
-
170
-
171
-
172
-
173
-
174
-
175
-
176
-
177
-
178
-
179
-
180
-
181
-
182
-
183
-
184
-
185
-
186
-
187
-
188
-
189
-
190
-
191
-
192
-
193
-
194
-
195
-
196
 |
 |

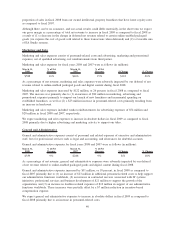
Income Taxes
Income tax expense (benefit) for fiscal years 2008 and 2007 were as follows (in millions):
March 31,
2008
Effective
Tax Rate
March 31,
2007
Effective
Tax Rate % Change
$(53) (10.3%) $66 48.2% (180%)
Our effective income tax benefit rate was 10.3 percent for fiscal 2008. Our income tax expense rate was
48.2 percent for fiscal 2007. For fiscal 2008, our effective income tax benefit rate was lower than the
U.S. statutory rate of 35.0 percent due to a number of factors, including non-deductible acquisition-related
costs, losses on strategic investments and certain loss on facility impairment for which future tax benefit is
uncertain and not more likely than not to be realized, as well as certain non-deductible stock based
compensation expenses. For fiscal 2007, our effective income tax rate was higher than the U.S. statutory rate
of 35.0 percent due to a number of factors, including certain non-deductible stock based compensation
expenses and additional charges resulting from certain non-deductible acquisition-related costs.
Our effective income tax rates for fiscal 2009 and future periods will depend on a variety of factors, including
changes in our business such as acquisitions and intercompany transactions (for example, we expect to incur
significant intercompany tax charges in connection with our acquisition of VGH in fiscal 2009), changes in
our international structure, changes in the geographic location of business functions or assets, changes in the
geographic mix of income, as well as changes in, or termination of, our agreements with tax authorities,
valuation allowances, applicable accounting rules, applicable tax laws and regulations, rulings and interpreta-
tions thereof, developments in tax audit and other matters, and variations in the estimated and actual level of
annual pre-tax income or loss. We incur certain tax expenses that do not decline proportionately with declines
in our pre-tax consolidated income or loss. As a result, in absolute dollar terms, our tax expense will have a
greater influence on our effective tax rate at lower levels of pre-tax income or loss than at higher levels. In
addition, at lower levels of pre-tax income or loss, our effective tax rate will be more volatile.
We historically have considered undistributed earnings of our foreign subsidiaries to be indefinitely reinvested
outside of the United States and, accordingly, no U.S. taxes have been provided thereon. Although we
repatriated funds under the American Jobs Creation Act of 2004 in fiscal 2006, we currently intend to continue
to indefinitely reinvest the undistributed earnings of our foreign subsidiaries outside of the United States.
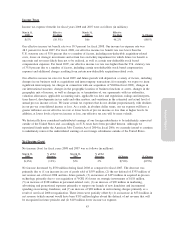
Net Income (Loss)
Net income (loss) for fiscal years 2008 and 2007 was as follows (in millions):
March 31,
2008
% of Net
Revenue
March 31,
2007
% of Net
Revenue $ Change % Change
$(454) (12%) $76 2% $(530) (697%)
Net income decreased by $530 million during fiscal 2008 as compared to fiscal 2007. The decrease was
primarily due to (1) an increase in cost of goods sold of $593 million, (2) the net deferral of $355 million of
net revenue out of fiscal 2008 and into future periods, (3) an increase of $135 million in acquired in-process
technology primarily due to our acquisition of VGH, (4) losses on strategic investments of $118 million,
(5) an increase of $108 million in personnel-related costs, (6) an increase of $90 million in marketing,
advertising and promotional expenses primarily to support our launch of new franchises and incremental
spending on recurring franchises, and (7) an increase of $88 million in restructuring charges primarily as a
result of our fiscal 2008 reorganization. These items were partially offset by (1) an increase in $574 million in
net revenue (which amount would have been $355 million higher absent the deferral of net revenue that will
be recognized in future periods) and (2) $119 million lower income tax expense.
Annual Report
43