Electronic Arts 2008 Annual Report Download - page 120
Download and view the complete annual report
Please find page 120 of the 2008 Electronic Arts annual report below. You can navigate through the pages in the report by either clicking on the pages listed below, or by using the keyword search tool below to find specific information within the annual report.-
 1
1 -
2
-
3
-
4
-
5
-
6
-
7
-
8
-
9
-
10
-
11
-
12
-
13
-
14
-
15
-
16
-
17
-
18
-
19
-
20
-
21
-
22
-
23
-
24
-
25
-
26
-
27
-
28
-
29
-
30
-
31
-
32
-
33
-
34
-
35
-
36
-
37
-
38
-
39
-
40
-
41
-
42
-
43
-
44
-
45
-
46
-
47
-
48
-
49
-
50
-
51
-
52
-
53
-
54
-
55
-
56
-
57
-
58
-
59
-
60
-
61
-
62
-
63
-
64
-
65
-
66
-
67
-
68
-
69
-
70
-
71
-
72
-
73
-
74
-
75
-
76
-
77
-
78
-
79
-
80
-
81
-
82
-
83
-
84
-
85
-
86
-
87
-
88
-
89
-
90
-
91
-
92
-
93
-
94
-
95
-
96
-
97
-
98
-
99
-
100
-
101
-
102
-
103
-
104
-
105
-
106
-
107
-
108
-
109
-
 110
110 -
 111
111 -
 112
112 -
 113
113 -
 114
114 -
 115
115 -
 116
116 -
 117
117 -
 118
118 -
 119
119 -
 120
120 -
 121
121 -
 122
122 -
 123
123 -
 124
124 -
 125
125 -
 126
126 -
 127
127 -
 128
128 -
 129
129 -
 130
130 -
131
-
132
-
133
-
134
-
135
-
136
-
137
-
138
-
139
-
140
-
141
-
142
-
143
-
144
-
145
-
146
-
147
-
148
-
149
-
150
-
151
-
152
-
153
-
154
-
155
-
156
-
157
-
158
-
159
-
160
-
161
-
162
-
163
-
164
-
165
-
166
-
167
-
168
-
169
-
170
-
171
-
172
-
173
-
174
-
175
-
176
-
177
-
178
-
179
-
180
-
181
-
182
-
183
-
184
-
185
-
186
-
187
-
188
-
189
-
190
-
191
-
192
-
193
-
194
-
195
-
196
 |
 |

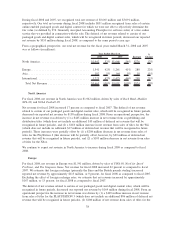
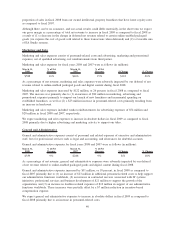
Comparison of Fiscal 2007 to Fiscal 2006
Net Revenue
From a geographical perspective, our total net revenue for fiscal years ended March 31, 2007 and 2006 was as
follows (in millions):
2007 2006
Increase /
(Decrease)
%
Change
Year Ended March 31,
North America.............................. $1,666 54% $1,584 54% $ 82 5%
Europe . . . ................................ 1,261 41% 1,174 40% 87 7%
Asia ..................................... 164 5% 193 6% (29) (15%)
International ............................... 1,425 46% 1,367 46% 58 4%
Total Net Revenue ......................... $3,091 100% $2,951 100% $140 5%
North America
For fiscal 2007, net revenue in North America was $1,666 million, driven by sales of Madden NFL 07,Need
for Speed Carbon, and NCAA Football 07.
The increase in net revenue for fiscal 2007 as compared to fiscal 2006 was driven by (1) a $239 million
increase in net revenue from sales of titles for the Xbox 360, (2) a $95 million increase in cellular handset net
revenue, and (3) $68 million in net revenue from sales of titles for the PLAYSTATION 3. These increases
were partially offset by (1) a $168 million decrease in net revenue from sales of titles for the Xbox, and (2) a
$127 million decrease in net revenue from sales of titles for the PlayStation 2.
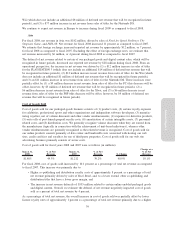
Europe
For fiscal 2007, net revenue in Europe was $1,261 million, driven primarily by sales of FIFA 07 and Need for
Speed Carbon. We estimate that foreign exchange rates (primarily the Euro and the British pounds sterling)
increased reported European net revenue by approximately $57 million, or 5 percent, for fiscal 2007 as
compared to fiscal 2006. Excluding the effect of foreign exchange rates, we estimate that European net
revenue increased by approximately $30 million, or 2 percent, for fiscal 2007 as compared to fiscal 2006.
The increase in net revenue for fiscal 2007 as compared to fiscal 2006 was driven by (1) a $90 million
increase in net revenue from sales of titles for the Xbox 360, and (2) a $76 million increase in net revenue
from sales of titles for the PC. These increases were partially offset by a $101 million decrease in net revenue
from sales of titles for the PlayStation 2.
Asia
For fiscal 2007, net revenue in Asia was $164 million, driven primarily by sales of Need for Speed Carbon.
We estimate that changes in foreign exchange rates decreased reported net revenue in Asia by approximately
$4 million, or 2 percent, for fiscal 2007 as compared to fiscal 2006. Excluding the effect of foreign exchange
rates, we estimate that Asia net revenue decreased by approximately $25 million, or 13 percent, for fiscal
2007 as compared to fiscal 2006.
The decrease in net revenue for fiscal 2007 as compared to fiscal 2006 was driven primarily by (1) a
$21 million decrease in net revenue from co-publishing and distribution titles, (2) a $13 million decrease in
net revenue from sales of titles for the PlayStation 2, and (3) an $11 million decrease in net revenue from
sales of titles for the Xbox. These decreases were partially offset by an $11 million increase in net revenue
from sales of titles for the Xbox 360.
44