Electronic Arts 2008 Annual Report Download - page 138
Download and view the complete annual report
Please find page 138 of the 2008 Electronic Arts annual report below. You can navigate through the pages in the report by either clicking on the pages listed below, or by using the keyword search tool below to find specific information within the annual report.-
 1
1 -
2
-
3
-
4
-
5
-
6
-
7
-
8
-
9
-
10
-
11
-
12
-
13
-
14
-
15
-
16
-
17
-
18
-
19
-
20
-
21
-
22
-
23
-
24
-
25
-
26
-
27
-
28
-
29
-
30
-
31
-
32
-
33
-
34
-
35
-
36
-
37
-
38
-
39
-
40
-
41
-
42
-
43
-
44
-
45
-
46
-
47
-
48
-
49
-
50
-
51
-
52
-
53
-
54
-
55
-
56
-
57
-
58
-
59
-
60
-
61
-
62
-
63
-
64
-
65
-
66
-
67
-
68
-
69
-
70
-
71
-
72
-
73
-
74
-
75
-
76
-
77
-
78
-
79
-
80
-
81
-
82
-
83
-
84
-
85
-
86
-
87
-
88
-
89
-
90
-
91
-
92
-
93
-
94
-
95
-
96
-
97
-
98
-
99
-
100
-
101
-
102
-
103
-
104
-
105
-
106
-
107
-
108
-
109
-
110
-
111
-
112
-
113
-
114
-
115
-
116
-
117
-
118
-
119
-
120
-
121
-
122
-
123
-
124
-
125
-
126
-
127
-
 128
128 -
 129
129 -
 130
130 -
 131
131 -
 132
132 -
 133
133 -
 134
134 -
 135
135 -
 136
136 -
 137
137 -
 138
138 -
 139
139 -
 140
140 -
 141
141 -
 142
142 -
 143
143 -
 144
144 -
 145
145 -
 146
146 -
 147
147 -
 148
148 -
149
-
150
-
151
-
152
-
153
-
154
-
155
-
156
-
157
-
158
-
159
-
160
-
161
-
162
-
163
-
164
-
165
-
166
-
167
-
168
-
169
-
170
-
171
-
172
-
173
-
174
-
175
-
176
-
177
-
178
-
179
-
180
-
181
-
182
-
183
-
184
-
185
-
186
-
187
-
188
-
189
-
190
-
191
-
192
-
193
-
194
-
195
-
196
 |
 |

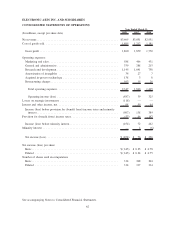
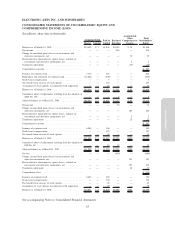
ELECTRONIC ARTS INC. AND SUBSIDIARIES
CONSOLIDATED STATEMENTS OF OPERATIONS
(In millions, except per share data) 2008 2007 2006
Year Ended March 31,
Net revenue .................................................... $3,665 $3,091 $2,951
Cost of goods sold ............................................... 1,805 1,212 1,181
Gross profit .................................................. 1,860 1,879 1,770
Operating expenses:
Marketing and sales ............................................ 588 466 431
General and administrative ....................................... 339 288 215
Research and development ....................................... 1,145 1,041 758
Amortization of intangibles ...................................... 34 27 7
Acquired in-process technology ................................... 138 3 8
Restructuring charges ........................................... 103 15 26
Total operating expenses....................................... 2,347 1,840 1,445
Operating income (loss) ....................................... (487) 39 325
Losses on strategic investments ..................................... (118) — —
Interest and other income, net ...................................... 98 99 64
Income (loss) before provision for (benefit from) income taxes and minority
interest.................................................... (507) 138 389
Provision for (benefit from) income taxes .............................. (53) 66 147
Income (loss) before minority interest ............................... (454) 72 242
Minorityinterest ................................................ — 4 (6)
Net income (loss).............................................. $ (454) $ 76 $ 236
Net income (loss) per share:
Basic ....................................................... $(1.45) $ 0.25 $ 0.78
Diluted ..................................................... $(1.45) $ 0.24 $ 0.75
Number of shares used in computation:
Basic ....................................................... 314 308 304
Diluted ..................................................... 314 317 314
See accompanying Notes to Consolidated Financial Statements.
62