Electronic Arts 2008 Annual Report Download - page 118
Download and view the complete annual report
Please find page 118 of the 2008 Electronic Arts annual report below. You can navigate through the pages in the report by either clicking on the pages listed below, or by using the keyword search tool below to find specific information within the annual report.-
 1
1 -
2
-
3
-
4
-
5
-
6
-
7
-
8
-
9
-
10
-
11
-
12
-
13
-
14
-
15
-
16
-
17
-
18
-
19
-
20
-
21
-
22
-
23
-
24
-
25
-
26
-
27
-
28
-
29
-
30
-
31
-
32
-
33
-
34
-
35
-
36
-
37
-
38
-
39
-
40
-
41
-
42
-
43
-
44
-
45
-
46
-
47
-
48
-
49
-
50
-
51
-
52
-
53
-
54
-
55
-
56
-
57
-
58
-
59
-
60
-
61
-
62
-
63
-
64
-
65
-
66
-
67
-
68
-
69
-
70
-
71
-
72
-
73
-
74
-
75
-
76
-
77
-
78
-
79
-
80
-
81
-
82
-
83
-
84
-
85
-
86
-
87
-
88
-
89
-
90
-
91
-
92
-
93
-
94
-
95
-
96
-
97
-
98
-
99
-
100
-
101
-
102
-
103
-
104
-
105
-
106
-
107
-
 108
108 -
 109
109 -
 110
110 -
 111
111 -
 112
112 -
 113
113 -
 114
114 -
 115
115 -
 116
116 -
 117
117 -
 118
118 -
 119
119 -
 120
120 -
 121
121 -
 122
122 -
 123
123 -
 124
124 -
 125
125 -
 126
126 -
 127
127 -
 128
128 -
129
-
130
-
131
-
132
-
133
-
134
-
135
-
136
-
137
-
138
-
139
-
140
-
141
-
142
-
143
-
144
-
145
-
146
-
147
-
148
-
149
-
150
-
151
-
152
-
153
-
154
-
155
-
156
-
157
-
158
-
159
-
160
-
161
-
162
-
163
-
164
-
165
-
166
-
167
-
168
-
169
-
170
-
171
-
172
-
173
-
174
-
175
-
176
-
177
-
178
-
179
-
180
-
181
-
182
-
183
-
184
-
185
-
186
-
187
-
188
-
189
-
190
-
191
-
192
-
193
-
194
-
195
-
196
 |
 |

Consolidated Statement of Operations. See Note 4 of the Notes to Consolidated Financial Statements included
in Item 8 of this report. In connection with our acquisition of VGH, we incurred acquired in-process
technology charges of $138 million in relation to game software that had not reached technical feasibility at
the date of acquisition. The fair values of VGH’s products under development were determined using the
income approach, which discounts expected future cash flows from the acquired in-process technology to
present value. The discount rates used in the present value calculations were derived from a weighted average
cost of capital of 17 percent. Should the in-process software not be successfully completed, completed at a
higher cost, or the development efforts go beyond the timeframe estimated by management, we will not
receive the full benefits anticipated from the acquisition. Benefits from the development efforts are expected to
commence in fiscal years 2009 through 2011. The acquired in-process technology charge we incurred in fiscal
2007 resulted from our acquisitions of Mythic and the remaining minority interest in DICE.
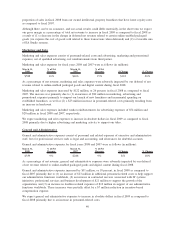
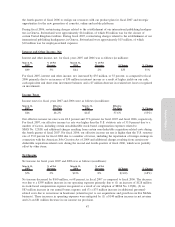
Restructuring Charges
Restructuring charges for fiscal years 2008 and 2007 were as follows (in millions):
March 31,
2008
% of Net
Revenue
March 31,
2007
% of Net
Revenue $ Change % Change
$103 3% $15 — $88 587%
In connection with our fiscal 2008 reorganization, during fiscal 2008, we incurred approximately $97 million
of reorganization charges, of which $58 million was for facilities-related expenses, $27 million was for other
expenses including other contract termination costs as well as IT and consulting costs to assist in the
reorganization of our business support functions, and $12 million was for employee-related expenses.
In connection with our fiscal 2006 international publishing reorganization, during fiscal 2008, we incurred
approximately $6 million of employee-related expenses. During fiscal 2007, restructuring charges related to
our fiscal 2006 international publishing reorganization were approximately $15 million, of which $10 million
was for employee-related expenses.
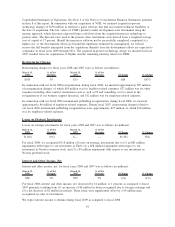
Losses on Strategic Investments
Losses on strategic investments for fiscal years 2008 and 2007 was as follows (in millions):
March 31,
2008
% of Net
Revenue
March 31,
2007
% of Net
Revenue $ Change % Change
$(118) (3%) $— — $(118) N/A
For fiscal 2008, we recognized $118 million of losses on strategic investments due to (1) an $81 million
impairment with respect to our investment in The9, (2) a $28 million impairment with respect to our
investment in Neowiz common stock, and (3) a $9 million impairment with respect to our investment in
Neowiz preferred stock.
Interest and Other Income, Net
Interest and other income, net, for fiscal years 2008 and 2007 was as follows (in millions):
March 31,
2008
% of Net
Revenue
March 31,
2007
% of Net
Revenue $ Change % Change
$98 3% $99 3% $(1) (1%)
For fiscal 2008, interest and other income, net, decreased by $1 million, or 1 percent, as compared to fiscal
2007 primarily resulting from (1) an increase of $8 million in losses recognized due to foreign exchange and
(2) a net decrease of $2 million in interest. These items were significantly offset by a $9 million gain
recognized on sales of investments.
We expect interest income to decline during fiscal 2009 as compared to fiscal 2008.
42