Electronic Arts 2008 Annual Report Download - page 148
Download and view the complete annual report
Please find page 148 of the 2008 Electronic Arts annual report below. You can navigate through the pages in the report by either clicking on the pages listed below, or by using the keyword search tool below to find specific information within the annual report.-
 1
1 -
2
-
3
-
4
-
5
-
6
-
7
-
8
-
9
-
10
-
11
-
12
-
13
-
14
-
15
-
16
-
17
-
18
-
19
-
20
-
21
-
22
-
23
-
24
-
25
-
26
-
27
-
28
-
29
-
30
-
31
-
32
-
33
-
34
-
35
-
36
-
37
-
38
-
39
-
40
-
41
-
42
-
43
-
44
-
45
-
46
-
47
-
48
-
49
-
50
-
51
-
52
-
53
-
54
-
55
-
56
-
57
-
58
-
59
-
60
-
61
-
62
-
63
-
64
-
65
-
66
-
67
-
68
-
69
-
70
-
71
-
72
-
73
-
74
-
75
-
76
-
77
-
78
-
79
-
80
-
81
-
82
-
83
-
84
-
85
-
86
-
87
-
88
-
89
-
90
-
91
-
92
-
93
-
94
-
95
-
96
-
97
-
98
-
99
-
100
-
101
-
102
-
103
-
104
-
105
-
106
-
107
-
108
-
109
-
110
-
111
-
112
-
113
-
114
-
115
-
116
-
117
-
118
-
119
-
120
-
121
-
122
-
123
-
124
-
125
-
126
-
127
-
128
-
129
-
130
-
131
-
132
-
133
-
134
-
135
-
136
-
137
-
 138
138 -
 139
139 -
 140
140 -
 141
141 -
 142
142 -
 143
143 -
 144
144 -
 145
145 -
 146
146 -
 147
147 -
 148
148 -
 149
149 -
 150
150 -
 151
151 -
 152
152 -
 153
153 -
 154
154 -
 155
155 -
 156
156 -
 157
157 -
 158
158 -
159
-
160
-
161
-
162
-
163
-
164
-
165
-
166
-
167
-
168
-
169
-
170
-
171
-
172
-
173
-
174
-
175
-
176
-
177
-
178
-
179
-
180
-
181
-
182
-
183
-
184
-
185
-
186
-
187
-
188
-
189
-
190
-
191
-
192
-
193
-
194
-
195
-
196
 |
 |

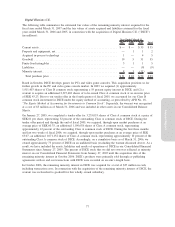
(b) Cash, Cash Equivalents and Short-term Investments
Cash, cash equivalents and short-term investments consisted of the following as of March 31, 2008 and 2007
(in millions):
Cost or
Amortized
Cost Gains Losses
Fair
Value
Cost or
Amortized
Cost Gains Losses
Fair
Value
Gross
Unrealized
Gross
Unrealized
As of March 31, 2008 As of March 31, 2007
Cash and cash equivalents:
Cash ........................ $ 292 $— $— $ 292 $ 194 $— $— $ 194
Money market funds ............ 1,251 — — 1,251 989 — — 989
Commercial paper .............. 7 — — 7 188 — — 188
U.S. agency securities ........... 3 — — 3 — — — —
Cash and cash equivalents....... 1,553 — — 1,553 1,371 — — 1,371
Short-term investments:
U.S. agency securities ........... 262 4 — 266 263 1 — 264
Corporate bonds . ............... 229 2 — 231 227 — (1) 226
U.S. Treasury securities .......... 159 2 — 161 92 — — 92
Asset-backed securities ........... 63 1 — 64 107 1 — 108
Commercial paper .............. 12 — — 12 574 — — 574
Short-term investments ......... 725 9 — 734 1,263 2 (1) 1,264
Cash, cash equivalents and short-term
investments ................... $2,278 $ 9 $— $2,287 $2,634 $ 2 $(1) $2,635
As of March 31, 2008 and 2007, we had less than $1 million and $1 million, respectively, in gross unrealized
losses primarily attributable to our corporate bond investments. These gross unrealized losses were in loss
positions for less than 12 months and 12 months or greater, as of March 31, 2008 and 2007, respectively.
We periodically evaluate our securities for impairment. Factors considered in the review of securities with an
unrealized loss include the credit quality of the issuer, the magnitude of the unrealized loss position, the length
of time that the security has been in a loss position, our intentions with respect to the selling or holding of
such security as well as any contractual terms impacting the prepayment or settlement process. Based on our
review, we do not consider the investments listed above to be other-than-temporarily impaired as of March 31,
2008.
Gross realized losses of $2 million and gross realized gains of $9 million were recognized from the sale of
short-term investments for the year ended March 31, 2008. Gross realized losses of $1 million and gross
realized gains of less than $1 million were recognized from the sale of short-term investments for the year
ended March 31, 2007. Gross realized losses of $9 million and gross realized gains of less than $1 million
were recognized from the sale of short-term investments for the year ended March 31, 2006.
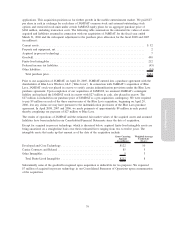
The following table summarizes the amortized cost and fair value of our short-term investments, classified by
stated maturity as of March 31, 2008 (in millions):
Amortized
Cost
Fair
Value
Due in 1 year or less .................................................... $163 $164
Due in 1-2 years........................................................ 254 257
Due in 2-3 years........................................................ 245 249
Asset-backed securities ................................................... 63 64
Short-term investments ................................................. $725 $734
72