Electronic Arts 2008 Annual Report Download - page 171
Download and view the complete annual report
Please find page 171 of the 2008 Electronic Arts annual report below. You can navigate through the pages in the report by either clicking on the pages listed below, or by using the keyword search tool below to find specific information within the annual report.-
 1
1 -
2
-
3
-
4
-
5
-
6
-
7
-
8
-
9
-
10
-
11
-
12
-
13
-
14
-
15
-
16
-
17
-
18
-
19
-
20
-
21
-
22
-
23
-
24
-
25
-
26
-
27
-
28
-
29
-
30
-
31
-
32
-
33
-
34
-
35
-
36
-
37
-
38
-
39
-
40
-
41
-
42
-
43
-
44
-
45
-
46
-
47
-
48
-
49
-
50
-
51
-
52
-
53
-
54
-
55
-
56
-
57
-
58
-
59
-
60
-
61
-
62
-
63
-
64
-
65
-
66
-
67
-
68
-
69
-
70
-
71
-
72
-
73
-
74
-
75
-
76
-
77
-
78
-
79
-
80
-
81
-
82
-
83
-
84
-
85
-
86
-
87
-
88
-
89
-
90
-
91
-
92
-
93
-
94
-
95
-
96
-
97
-
98
-
99
-
100
-
101
-
102
-
103
-
104
-
105
-
106
-
107
-
108
-
109
-
110
-
111
-
112
-
113
-
114
-
115
-
116
-
117
-
118
-
119
-
120
-
121
-
122
-
123
-
124
-
125
-
126
-
127
-
128
-
129
-
130
-
131
-
132
-
133
-
134
-
135
-
136
-
137
-
138
-
139
-
140
-
141
-
142
-
143
-
144
-
145
-
146
-
147
-
148
-
149
-
150
-
151
-
152
-
153
-
154
-
155
-
156
-
157
-
158
-
159
-
160
-
 161
161 -
 162
162 -
 163
163 -
 164
164 -
 165
165 -
 166
166 -
 167
167 -
 168
168 -
 169
169 -
 170
170 -
 171
171 -
 172
172 -
 173
173 -
 174
174 -
 175
175 -
 176
176 -
 177
177 -
 178
178 -
 179
179 -
 180
180 -
 181
181 -
182
-
183
-
184
-
185
-
186
-
187
-
188
-
189
-
190
-
191
-
192
-
193
-
194
-
195
-
196
 |
 |

Additional stock option-related information as of March 31, 2008:
Options
(in thousands)
Weighted-
Average
Exercise Price
Weighted-
Average
Remaining
Contractual
Term (in years)
Aggregate
Intrinsic Value
(in millions)
Vested and expected to vest ............... 32,891 $42.54 5.9 $302
Exercisable ........................... 22,698 $38.42 4.8 $294
As of March 31, 2008, the weighted-average contractual term for our stock options outstanding was 6.2 years
and the aggregate intrinsic value of our stock options outstanding was $305 million.
A total of 17 million shares were available for grant under our Equity Plan as of March 31, 2008, of which no
more than 6 million shares were eligible for grant in the form of restricted stock or restricted stock units.
The aggregate intrinsic value represents the total pre-tax intrinsic value based on our closing stock price as of
March 31, 2008, which would have been received by the option holders had all option holders exercised their
options as of that date. We issue new common stock from our authorized shares upon the exercise of stock
options.
The weighted-average grant-date fair value of stock options granted during fiscal years 2008, 2007 and 2006
was $16.85, $17.75 and $15.19, respectively. The total intrinsic value of options exercised during fiscal years
2008, 2007 and 2006 was $144 million, $120 million and $199 million, respectively. The total estimated fair
value (determined as of the grant date) of shares vested during fiscal years 2008, 2007 and 2006 was
$82 million, $105 million and $150 million, respectively.
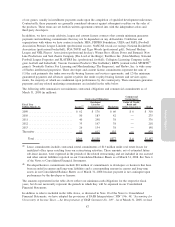
The following table summarizes outstanding and exercisable options as of March 31, 2008:
Range of
Exercise Prices
Number
of Shares
(in thousands)
Weighted-
Average
Remaining
Contractual
Term (in years)
Weighted-
Average
Exercise
Price
Potential
Dilution
Number
of Shares
(in thousands)
Weighted-
Average
Exercise
Price
Potential
Dilution
Options Outstanding Options Exercisable
$0.65-$19.99 2,173 1.21 $14.01 0.7% 2,172 $14.01 0.7%
20.00-29.99 5,984 3.42 25.79 1.9% 5,627 25.58 1.8%
30.00-39.99 4,221 4.47 31.77 1.3% 4,192 31.76 1.3%
40.00-49.99 9,843 7.65 48.16 3.1% 4,338 47.15 1.3%
50.00-59.99 11,279 7.76 53.59 3.5% 4,707 53.73 1.5%
60.00-65.93 2,577 6.76 64.25 0.8% 1,662 64.40 0.5%
$0.65-$65.93 36,077 6.16 43.32 11.3% 22,698 38.42 7.1%
Potential dilution is computed by dividing the options in the related range of exercise prices by 318 million
shares of common stock, which were issued and outstanding as of March 31, 2008.
At our Annual Meeting of Stockholders, held on July 26, 2007, our stockholders approved amendments to the
2000 Equity Incentive Plan to (a) increase the number of shares authorized for issuance under the Equity Plan
by 9 million, (b) decrease by 4 million shares the limit on the total number of shares underlying awards of
restricted stock and restricted stock units that may be granted under the Equity Plan — from 15 million to
11 million shares, and (c) revise the amount and nature of automatic initial and annual grants to our non-
employee directors under the Equity Plan by adding restricted stock units and decreasing the size of stock
option grants.
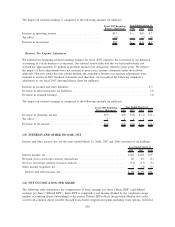
Restricted Stock Units and Restricted Stock
We grant restricted stock units and restricted stock (collectively referred to as “restricted stock rights”) under
our Equity Plan to employees worldwide (except in certain countries where doing so is not feasible due to
local legal requirements). Restricted stock units entitle holders to receive shares of common stock at the end
Annual Report
95