Electronic Arts 2008 Annual Report Download - page 135
Download and view the complete annual report
Please find page 135 of the 2008 Electronic Arts annual report below. You can navigate through the pages in the report by either clicking on the pages listed below, or by using the keyword search tool below to find specific information within the annual report.-
 1
1 -
2
-
3
-
4
-
5
-
6
-
7
-
8
-
9
-
10
-
11
-
12
-
13
-
14
-
15
-
16
-
17
-
18
-
19
-
20
-
21
-
22
-
23
-
24
-
25
-
26
-
27
-
28
-
29
-
30
-
31
-
32
-
33
-
34
-
35
-
36
-
37
-
38
-
39
-
40
-
41
-
42
-
43
-
44
-
45
-
46
-
47
-
48
-
49
-
50
-
51
-
52
-
53
-
54
-
55
-
56
-
57
-
58
-
59
-
60
-
61
-
62
-
63
-
64
-
65
-
66
-
67
-
68
-
69
-
70
-
71
-
72
-
73
-
74
-
75
-
76
-
77
-
78
-
79
-
80
-
81
-
82
-
83
-
84
-
85
-
86
-
87
-
88
-
89
-
90
-
91
-
92
-
93
-
94
-
95
-
96
-
97
-
98
-
99
-
100
-
101
-
102
-
103
-
104
-
105
-
106
-
107
-
108
-
109
-
110
-
111
-
112
-
113
-
114
-
115
-
116
-
117
-
118
-
119
-
120
-
121
-
122
-
123
-
124
-
 125
125 -
 126
126 -
 127
127 -
 128
128 -
 129
129 -
 130
130 -
 131
131 -
 132
132 -
 133
133 -
 134
134 -
 135
135 -
 136
136 -
 137
137 -
 138
138 -
 139
139 -
 140
140 -
 141
141 -
 142
142 -
 143
143 -
 144
144 -
 145
145 -
146
-
147
-
148
-
149
-
150
-
151
-
152
-
153
-
154
-
155
-
156
-
157
-
158
-
159
-
160
-
161
-
162
-
163
-
164
-
165
-
166
-
167
-
168
-
169
-
170
-
171
-
172
-
173
-
174
-
175
-
176
-
177
-
178
-
179
-
180
-
181
-
182
-
183
-
184
-
185
-
186
-
187
-
188
-
189
-
190
-
191
-
192
-
193
-
194
-
195
-
196
 |
 |

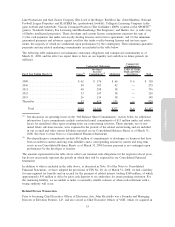
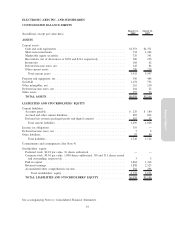
Consolidated Balance Sheets at fair market value with unrealized gains or losses reported as a separate
component of accumulated other comprehensive income, net of any tax effects, in stockholders’ equity. The
fair value of our marketable equity securities was $729 million and $341 million as of March 31, 2008 and
2007, respectively. In fiscal 2008, we recognized an other-than-temporary impairment loss of $109 million.
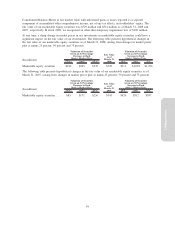
At any time, a sharp change in market prices in our investments in marketable equity securities could have a
significant impact on the fair value of our investments. The following table presents hypothetical changes in
the fair value of our marketable equity securities as of March 31, 2008, arising from changes in market prices
plus or minus 25 percent, 50 percent and 75 percent.
(In millions) (75%) (50%) (25%)
Fair Value
as of
March 31,
2008 25% 50% 75%
Valuation of Securities
Given an X Percentage
Decrease in Each
Stock’s Market Price
Valuation of Securities
Given an X Percentage
Increase in Each
Stock’s Market Price
Marketable equity securities .... $182 $365 $547 $729 $911 $1,094 $1,276
The following table presents hypothetical changes in the fair value of our marketable equity securities as of
March 31, 2007, arising from changes in market prices plus or minus 25 percent, 50 percent and 75 percent.
(In millions) (75%) (50%) (25%)
Fair Value
as of
March 31,
2007 25% 50% 75%
Valuation of Securities
Given an X Percentage
Decrease in Each
Stock’s Market Price
Valuation of Securities
Given an X Percentage
Increase in Each
Stock’s Market Price
Marketable equity securities .... $85 $171 $256 $341 $426 $512 $597
Annual Report
59