Ford 2013 Annual Report Download - page 105
Download and view the complete annual report
Please find page 105 of the 2013 Ford annual report below. You can navigate through the pages in the report by either clicking on the pages listed below, or by using the keyword search tool below to find specific information within the annual report.-
 1
1 -
2
-
3
-
4
-
5
-
6
-
7
-
8
-
9
-
10
-
11
-
12
-
13
-
14
-
15
-
16
-
17
-
18
-
19
-
20
-
21
-
22
-
23
-
24
-
25
-
26
-
27
-
28
-
29
-
30
-
31
-
32
-
33
-
34
-
35
-
36
-
37
-
38
-
39
-
40
-
41
-
42
-
43
-
44
-
45
-
46
-
47
-
48
-
49
-
50
-
51
-
52
-
53
-
54
-
55
-
56
-
57
-
58
-
59
-
60
-
61
-
62
-
63
-
64
-
65
-
66
-
67
-
68
-
69
-
70
-
71
-
72
-
73
-
74
-
75
-
76
-
77
-
78
-
79
-
80
-
81
-
82
-
83
-
84
-
85
-
86
-
87
-
88
-
89
-
90
-
91
-
92
-
93
-
94
-
 95
95 -
 96
96 -
 97
97 -
 98
98 -
 99
99 -
 100
100 -
 101
101 -
 102
102 -
 103
103 -
 104
104 -
 105
105 -
 106
106 -
 107
107 -
 108
108 -
 109
109 -
 110
110 -
 111
111 -
 112
112 -
 113
113 -
 114
114 -
 115
115 -
116
-
117
-
118
-
119
-
120
-
121
-
122
-
123
-
124
-
125
-
126
-
127
-
128
-
129
-
130
-
131
-
132
-
133
-
134
-
135
-
136
-
137
-
138
-
139
-
140
-
141
-
142
-
143
-
144
-
145
-
146
-
147
-
148
-
149
-
150
-
151
-
152
 |
 |

Ford Motor Company | 2013 Annual Report 103
FORD MOTOR COMPANY AND SUBSIDIARIES
NOTES TO THE FINANCIAL STATEMENTS
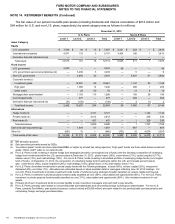
NOTE 14. RETIREMENT BENEFITS (Continued)
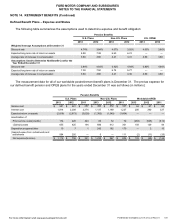
Defined Benefit Plans – Expense and Status
The following table summarizes the assumptions used to determine expense and benefit obligation:
Pension Benefits
U.S. Plans Non-U.S. Plans U.S. OPEB
2013 2012 2013 2012 2013 2012
Weighted Average Assumptions at December 31
Discount rate 4.74%3.84%4.07%3.92%4.65% 3.80%
Expected long-term rate of return on assets 6.89 7.38 6.63 6.74 — —
Average rate of increase in compensation 3.80 3.80 3.41 3.41 3.80 3.80
Assumptions Used to Determine Net Benefit Cost for the
Year Ended December 31
Discount rate 3.84%4.64%3.92%4.84%3.80% 4.60%
Expected long-term rate of return on assets 7.38 7.50 6.74 6.77 — —
Average rate of increase in compensation 3.80 3.80 3.41 3.39 3.80 3.80
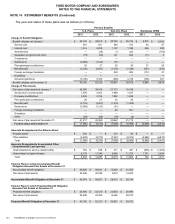
The measurement date for all of our worldwide postretirement benefit plans is December 31. The pre-tax expense for
our defined benefit pension and OPEB plans for the years ended December 31 was as follows (in millions):
Pension Benefits
U.S. Plans Non-U.S. Plans Worldwide OPEB
2013 2012 2011 2013 2012 2011 2013 2012 2011
Service cost $ 581 $ 521 $ 467 $484 $372 $327 $ 64 $ 67 $ 63
Interest cost 1,914 2,208 2,374 1,137 1,189 1,227 256 290 327
Expected return on assets (2,816) (2,873) (3,028) (1,382) (1,340) (1,404) — — —
Amortization of:
Prior service costs/(credits) 174 220 343 66 72 72 (283)(545) (612)
(Gains)/Losses 655 425 194 686 412 301 158 129 94
Separation programs/other 10 7 1 242 162 170 —210
(Gains)/Losses from curtailments and
settlements 594 250 — 5 — 111 (2) (11)(26)
Net expense/(income) $ 1,112 $ 758 $ 351 $1,238 $867 $804 $193 $(68) $ (144)
For more information visit www.annualreport.ford.com