Ford 2013 Annual Report Download - page 73
Download and view the complete annual report
Please find page 73 of the 2013 Ford annual report below. You can navigate through the pages in the report by either clicking on the pages listed below, or by using the keyword search tool below to find specific information within the annual report.-
 1
1 -
2
-
3
-
4
-
5
-
6
-
7
-
8
-
9
-
10
-
11
-
12
-
13
-
14
-
15
-
16
-
17
-
18
-
19
-
20
-
21
-
22
-
23
-
24
-
25
-
26
-
27
-
28
-
29
-
30
-
31
-
32
-
33
-
34
-
35
-
36
-
37
-
38
-
39
-
40
-
41
-
42
-
43
-
44
-
45
-
46
-
47
-
48
-
49
-
50
-
51
-
52
-
53
-
54
-
55
-
56
-
57
-
58
-
59
-
60
-
61
-
62
-
 63
63 -
 64
64 -
 65
65 -
 66
66 -
 67
67 -
 68
68 -
 69
69 -
 70
70 -
 71
71 -
 72
72 -
 73
73 -
 74
74 -
 75
75 -
 76
76 -
 77
77 -
 78
78 -
 79
79 -
 80
80 -
 81
81 -
 82
82 -
 83
83 -
84
-
85
-
86
-
87
-
88
-
89
-
90
-
91
-
92
-
93
-
94
-
95
-
96
-
97
-
98
-
99
-
100
-
101
-
102
-
103
-
104
-
105
-
106
-
107
-
108
-
109
-
110
-
111
-
112
-
113
-
114
-
115
-
116
-
117
-
118
-
119
-
120
-
121
-
122
-
123
-
124
-
125
-
126
-
127
-
128
-
129
-
130
-
131
-
132
-
133
-
134
-
135
-
136
-
137
-
138
-
139
-
140
-
141
-
142
-
143
-
144
-
145
-
146
-
147
-
148
-
149
-
150
-
151
-
152
 |
 |

Ford Motor Company | 2013 Annual Report 71
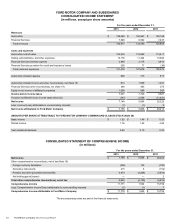
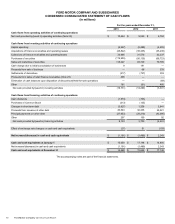
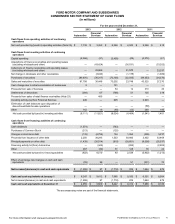
FORD MOTOR COMPANY AND SUBSIDIARIES
CONDENSED SECTOR STATEMENT OF CASH FLOWS
(in millions)
For the years ended December 31,
2013 2012 2011
Automotive
Financial
Services Automotive
Financial
Services Automotive
Financial
Services
Cash flows from operating activities of continuing
operations
Net cash provided by/(used in) operating activities (Note 25) $ 7,738 $3,352 $6,266 $2,043 $9,368 $418
Cash flows from investing activities of continuing
operations
Capital spending (6,566)(31) (5,459) (29)(4,272)(21)
Acquisitions of finance receivables and operating leases
(excluding wholesale and other) — (43,424) — (36,531) — (33,252)
Collections of finance receivables and operating leases
(excluding wholesale and other) — 33,966 —31,570 — 33,337
Net change in wholesale and other receivables — (3,044) — (1,178) — (1,989)
Purchases of securities (89,676) (30,317) (73,100) (22,035) (44,353) (24,370)
Sales and maturities of securities 87,799 30,448 70,202 23,748 43,525 27,270
Cash change due to initial consolidation of businesses 9 — 191 ———
Proceeds from sale of business — — 54 12 310 23
Settlements of derivatives (284) 67 (788) 51 135 218
Proceeds from sales of retail finance receivables (Note 23) — 495 ————
Investing activity (to)/from Financial Services 445 —925 —2,903 —
Elimination of cash balances upon disposition of
discontinued/held-for-sale operations — — — — (69) —
Other 162 19 (49)(12)280 185
Net cash provided by/(used in) investing activities (8,111) (11,821) (8,024) (4,404) (1,541) 1,401
Cash flows from financing activities of continuing
operations
Cash dividends (1,574) — (763) — — —
Purchases of Common Stock (213) — (125) — — —
Changes in short-term debt (133) (2,794) 154 1,054 (396) 3,237
Proceeds from issuance of other debt 2,250 38,293 1,553 30,883 2,452 33,469
Principal payments on other debt (1,439) (26,514) (810) (28,601) (8,058) (35,037)
Financing activity to/(from) Automotive — (445) — (925) — (2,903)
Other 287 (30) 31 128 70 22
Net cash provided by/(used in) financing activities (822)8,510 40 2,539 (5,932)(1,212)
Effect of exchange rate changes on cash and cash
equivalents (93) 56 — 51 (231) 72
Net increase/(decrease) in cash and cash equivalents $(1,288) $ 97 $ (1,718) $ 229 $1,664 $679
Cash and cash equivalents at January 1 $6,247 $9,412 $7,965 $9,183 $6,301 $ 8,504
Net increase/(decrease) in cash and cash equivalents (1,288) 97 (1,718) 229 1,664 679
Cash and cash equivalents at December 31 $4,959 $9,509 $6,247 $9,412 $7,965 $ 9,183
The accompanying notes are part of the financial statements.
For more information visit www.annualreport.ford.com