Ford 2013 Annual Report Download - page 23
Download and view the complete annual report
Please find page 23 of the 2013 Ford annual report below. You can navigate through the pages in the report by either clicking on the pages listed below, or by using the keyword search tool below to find specific information within the annual report.-
 1
1 -
2
-
3
-
4
-
5
-
6
-
7
-
8
-
9
-
10
-
11
-
12
-
 13
13 -
 14
14 -
 15
15 -
 16
16 -
 17
17 -
 18
18 -
 19
19 -
 20
20 -
 21
21 -
 22
22 -
 23
23 -
 24
24 -
 25
25 -
 26
26 -
 27
27 -
 28
28 -
 29
29 -
 30
30 -
 31
31 -
 32
32 -
 33
33 -
34
-
35
-
36
-
37
-
38
-
39
-
40
-
41
-
42
-
43
-
44
-
45
-
46
-
47
-
48
-
49
-
50
-
51
-
52
-
53
-
54
-
55
-
56
-
57
-
58
-
59
-
60
-
61
-
62
-
63
-
64
-
65
-
66
-
67
-
68
-
69
-
70
-
71
-
72
-
73
-
74
-
75
-
76
-
77
-
78
-
79
-
80
-
81
-
82
-
83
-
84
-
85
-
86
-
87
-
88
-
89
-
90
-
91
-
92
-
93
-
94
-
95
-
96
-
97
-
98
-
99
-
100
-
101
-
102
-
103
-
104
-
105
-
106
-
107
-
108
-
109
-
110
-
111
-
112
-
113
-
114
-
115
-
116
-
117
-
118
-
119
-
120
-
121
-
122
-
123
-
124
-
125
-
126
-
127
-
128
-
129
-
130
-
131
-
132
-
133
-
134
-
135
-
136
-
137
-
138
-
139
-
140
-
141
-
142
-
143
-
144
-
145
-
146
-
147
-
148
-
149
-
150
-
151
-
152
 |
 |

Ford Motor Company | 2013 Annual Report 21
Management’s Discussion and Analysis of Financial Condition and Results of Operations (Continued)
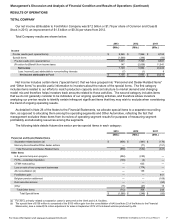
Total costs and expenses for our Automotive sector for 2013 and 2012 was $135.2 billion and $122 billion,
respectively, a difference of $13.2 billion. An explanation of the change is shown below (in billions):
2013
Better/(Worse)
2012
Explanation of change:
Volume and mix, exchange, and other $ (8.6)
Contribution costs (a)
Commodity costs (incl. hedging) 0.2
Material costs excluding commodity costs (0.6)
Warranty/Freight (0.4)
Other costs (a)
Structural costs (2.9)
Other (0.3)
Special items (0.6)
Total $ (13.2)
_________
(a) Our key cost change elements are measured primarily at present-year exchange; in addition, costs that vary directly with volume, such as material,
freight and warranty costs, are measured at present-year volume and mix. Excludes special items.
Results by Automotive Segment. Details by segment of Income before income taxes are shown below for 2013.
In 2013, Automotive pre-tax profit was the highest in more than a decade, with record profits in North America and
Asia Pacific Africa, an about breakeven result in South America, and a lower loss in Europe than last year. Other
Automotive reflects net interest expense, offset partially by a favorable fair market value adjustment of our investment in
Mazda.
For more information visit www.annualreport.ford.com