Ford 2013 Annual Report Download - page 86
Download and view the complete annual report
Please find page 86 of the 2013 Ford annual report below. You can navigate through the pages in the report by either clicking on the pages listed below, or by using the keyword search tool below to find specific information within the annual report.-
 1
1 -
2
-
3
-
4
-
5
-
6
-
7
-
8
-
9
-
10
-
11
-
12
-
13
-
14
-
15
-
16
-
17
-
18
-
19
-
20
-
21
-
22
-
23
-
24
-
25
-
26
-
27
-
28
-
29
-
30
-
31
-
32
-
33
-
34
-
35
-
36
-
37
-
38
-
39
-
40
-
41
-
42
-
43
-
44
-
45
-
46
-
47
-
48
-
49
-
50
-
51
-
52
-
53
-
54
-
55
-
56
-
57
-
58
-
59
-
60
-
61
-
62
-
63
-
64
-
65
-
66
-
67
-
68
-
69
-
70
-
71
-
72
-
73
-
74
-
75
-
 76
76 -
 77
77 -
 78
78 -
 79
79 -
 80
80 -
 81
81 -
 82
82 -
 83
83 -
 84
84 -
 85
85 -
 86
86 -
 87
87 -
 88
88 -
 89
89 -
 90
90 -
 91
91 -
 92
92 -
 93
93 -
 94
94 -
 95
95 -
 96
96 -
97
-
98
-
99
-
100
-
101
-
102
-
103
-
104
-
105
-
106
-
107
-
108
-
109
-
110
-
111
-
112
-
113
-
114
-
115
-
116
-
117
-
118
-
119
-
120
-
121
-
122
-
123
-
124
-
125
-
126
-
127
-
128
-
129
-
130
-
131
-
132
-
133
-
134
-
135
-
136
-
137
-
138
-
139
-
140
-
141
-
142
-
143
-
144
-
145
-
146
-
147
-
148
-
149
-
150
-
151
-
152
 |
 |

84 Ford Motor Company | 2013 Annual Report
FORD MOTOR COMPANY AND SUBSIDIARIES
NOTES TO THE FINANCIAL STATEMENTS
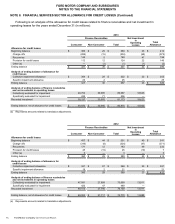
NOTE 4. FAIR VALUE MEASUREMENTS (Continued)
Input Hierarchy of Items Measured at Fair Value on a Recurring Basis
The following tables categorize the fair values of items measured at fair value on a recurring basis on our balance
sheet (in millions):
December 31, 2013 December 31, 2012
Level 1 Level 2 Level 3 Total Level 1 Level 2 Level 3 Total
Automotive Sector
Assets
Cash equivalents – financial instruments
U.S. government $ — $ 9 $ — $ 9 $ — $ — $ — $ —
U.S. government-sponsored enterprises — 24 — 24 — 718 —718
Non-U.S. government — 200 — 200 —139 —139
Non-U.S. government agencies (a) — — — — — 365 —365
Total cash equivalents – financial
instruments (b) — 233 — 233 —1,222 — 1,222
Marketable securities
U.S. government 3,752 — — 3,752 4,493 — — 4,493
U.S. government-sponsored enterprises — 6,596 —6,596 —5,459 — 5,459
Non-U.S. government agencies (a) — 5,423 —5,423 —4,794 — 4,794
Corporate debt — 2,623 —2,623 —1,871 — 1,871
Mortgage-backed and other asset-backed — 295 — 295 — 25 — 25
Equities 341 — — 341 142 — — 142
Non-U.S. government — 1,115 —1,115 —1,367 — 1,367
Other liquid investments (c) — 12 — 12 — 27 — 27
Total marketable securities 4,093 16,064 —20,157 4,635 13,543 — 18,178
Derivative financial instruments
Foreign currency exchange contracts — 557 — 557 —218 —218
Commodity contracts — 22 1 23 — 19 423
Total derivative financial instruments (d) — 579 1 580 —237 4 241
Total assets at fair value $ 4,093 $16,876 $ 1 $ 20,970 $4,635 $15,002 $4$ 19,641
Liabilities
Derivative financial instruments
Foreign currency exchange contracts $ — $ 399 $ — $ 399 $ — $ 486 $ — $ 486
Commodity contracts — 17 2 19 — 112 12 124
Total derivative financial instruments (d) — 416 2 418 —598 12 610
Total liabilities at fair value $ — $ 416 $ 2 $ 418 $ — $ 598 $ 12 $ 610
__________
(a) Includes notes issued by non-U.S. government agencies, as well as notes issued by supranational institutions.
(b) Excludes time deposits, certificates of deposit, money market accounts, and other cash equivalents reported at par value on our balance sheet
totaling $2.7 billion and $3 billion at December 31, 2013 and 2012, respectively, for the Automotive sector. In addition to these cash equivalents,
our Automotive sector also had cash on hand totaling $2 billion and $2 billion at December 31, 2013 and 2012, respectively.
(c) Includes certificates of deposit and time deposits subject to changes in value.
(d) See Note 16 for additional information regarding derivative financial instruments.