Ford 2013 Annual Report Download - page 68
Download and view the complete annual report
Please find page 68 of the 2013 Ford annual report below. You can navigate through the pages in the report by either clicking on the pages listed below, or by using the keyword search tool below to find specific information within the annual report.-
 1
1 -
2
-
3
-
4
-
5
-
6
-
7
-
8
-
9
-
10
-
11
-
12
-
13
-
14
-
15
-
16
-
17
-
18
-
19
-
20
-
21
-
22
-
23
-
24
-
25
-
26
-
27
-
28
-
29
-
30
-
31
-
32
-
33
-
34
-
35
-
36
-
37
-
38
-
39
-
40
-
41
-
42
-
43
-
44
-
45
-
46
-
47
-
48
-
49
-
50
-
51
-
52
-
53
-
54
-
55
-
56
-
57
-
 58
58 -
 59
59 -
 60
60 -
 61
61 -
 62
62 -
 63
63 -
 64
64 -
 65
65 -
 66
66 -
 67
67 -
 68
68 -
 69
69 -
 70
70 -
 71
71 -
 72
72 -
 73
73 -
 74
74 -
 75
75 -
 76
76 -
 77
77 -
 78
78 -
79
-
80
-
81
-
82
-
83
-
84
-
85
-
86
-
87
-
88
-
89
-
90
-
91
-
92
-
93
-
94
-
95
-
96
-
97
-
98
-
99
-
100
-
101
-
102
-
103
-
104
-
105
-
106
-
107
-
108
-
109
-
110
-
111
-
112
-
113
-
114
-
115
-
116
-
117
-
118
-
119
-
120
-
121
-
122
-
123
-
124
-
125
-
126
-
127
-
128
-
129
-
130
-
131
-
132
-
133
-
134
-
135
-
136
-
137
-
138
-
139
-
140
-
141
-
142
-
143
-
144
-
145
-
146
-
147
-
148
-
149
-
150
-
151
-
152
 |
 |

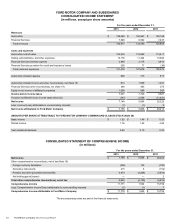
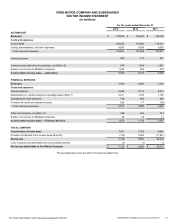
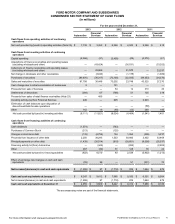
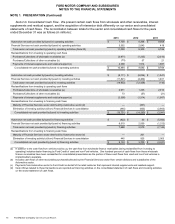
66 Ford Motor Company | 2013 Annual Report
FORD MOTOR COMPANY AND SUBSIDIARIES
CONSOLIDATED INCOME STATEMENT
(in millions, except per share amounts)
For the years ended December 31,
2013 2012 2011
Revenues
Automotive $ 139,369 $ 126,567 $128,168
Financial Services 7,548 6,992 7,437
Total revenues 146,917 133,559 135,605
Costs and expenses
Automotive cost of sales 125,234 112,992 113,611
Selling, administrative, and other expenses 13,176 11,494 10,884
Financial Services interest expense 2,860 3,115 3,614
Financial Services provision for credit and insurance losses 208 77 (36)
Total costs and expenses 141,478 127,678 128,073
Automotive interest expense 829 713 817
Automotive interest income and other income/(loss), net (Note 19) 974 1,599 1,091
Financial Services other income/(loss), net (Note 19) 348 365 375
Equity in net income of affiliated companies 1,069 588 500
Income before income taxes 7,001 7,720 8,681
Provision for/(Benefit from) income taxes (Note 22) (147)2,056 (11,541)
Net income 7,148 5,664 20,222
Less: Income/(Loss) attributable to noncontrolling interests (7) (1) 9
Net income attributable to Ford Motor Company $7,155 $5,665 $ 20,213
AMOUNTS PER SHARE ATTRIBUTABLE TO FORD MOTOR COMPANY COMMON AND CLASS B STOCK (Note 24)
Basic income $ 1.82 $1.48 $5.33
Diluted income 1.76 1.42 4.94
Cash dividends declared 0.40 0.15 0.05
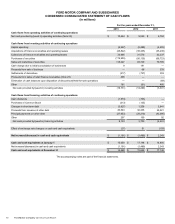
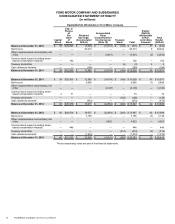
CONSOLIDATED STATEMENT OF COMPREHENSIVE INCOME
(in millions)
For the years ended December 31,
2013 2012 2011
Net income $7,148 $5,664 $ 20,222
Other comprehensive income/(loss), net of tax (Note 18)
Foreign currency translation (506)142 (720)
Derivative instruments 215 6 (152)
Pension and other postretirement benefits 4,914 (4,268)(3,553)
Net holding gains/(losses) — — 2
Total other comprehensive income/(loss), net of tax 4,623 (4,120)(4,423)
Comprehensive income 11,771 1,544 15,799
Less: Comprehensive income/(loss) attributable to noncontrolling interests (7) (1) 7
Comprehensive income attributable to Ford Motor Company $11,778 $1,545 $ 15,792
The accompanying notes are part of the financial statements.